Good Morning and God Bless You! I want all of you to please keep me in your prayers and thoughts because I have been suffering from seizures, for 43 years now, and diabetes for 10 years now. I also would like for you to please keep me and my entire family members and friends in your prayers and thoughts. My family members and I are trying to keep the peace with each other right now. On this particular day, I graduated from Paul Laurence Dunbar High School in Dayton Ohio. This is my 39th year Anniversary. I hope that everyone is having a nice day. Please pray that I am able to get a job because the President of the United States has signed an Executive Order indicating that people who receive monthly pensions will have their wages garnished starting after Labor Day of this year. I also want to say that I have been suffering from Schizoid Affective Disorder for 28 years now. As of Tuesday July 15, 2025, I will be suffering from Schizoid Affective Disorder, which is a mental illness for 28 years now. On Father’s Day of this year, I moved to Charlotte, North Carolina 28 years ago this Sunday. I owe a total of $28, 000 dollars in student loan debt as well as my medical bills, and other debts. I really need a job and a place to live because my rent is a total of $1,000 dollars in rent. My rent increased due to a technicality. I do have one question, can a Landlord increase your rent by writing a handwritten note? Please pray for me because I need a good paying job, and a decent place to live rather than staying with my relatives right now; due to an eviction on Tuesday January 21, 2025 at 2:00PM. I really need a job really bad. I love all of you very much. Love Your Neighbor as Yourself! Love The Lord God with all of your heart and all of your mind, and with all of your strength. Please allow God to bless me with a Job immaturity before I would end up suffering dearly. I feel defeated and depleted right now.
United Nation
Skip to main contentToggle navigation


Shaping our future togetherToggle navigation

Inequality – Bridging the Divide
Today, wherever people live, they don’t have to look far to confront inequalities. Inequality in its various forms is an issue that will define our time. Confronting inequalities has moved to the forefront of many global policy debates as a consensus has emerged that all should enjoy equal access to opportunity. ‘Leave no one behind’ serves as the rallying cry of the 2030 Agenda for Sustainable Development.
Overall, since the 1990s total global inequality (inequality across all individuals in the world) declined for the first time since the 1820s. Reinforcing this trend, we have mostly seen income inequality between countries decline. Yet income inequality within countries has risen, this is the form of inequality people feel on a daily basis.
Inequalities are not only driven and measured by income, but are determined by other factors – gender, age, origin, ethnicity, disability, sexual orientation, class, and religion. These factors determine inequalities of opportunity which continue to persist, within and between countries. In some parts of the world, these divides are becoming more pronounced. Meanwhile, gaps in newer areas, such as access to online and mobile technologies, are emerging. The result is a complex mix of internal and external challenges that will continue to grow over the next twenty-five years.
Income inequality between countries has improved
For the most part we have seen income inequality between countries improve in the last 25 years, meaning average incomes in developing countries are increasing at a faster rate. This can be accredited to strong economic growth in China and other emerging economies in Asia. However, the gap between countries is still considerable. For example, the average income of people living in North America is 16 times higher than that of people in sub-Saharan Africa.
Income inequality within countries is getting worse
Income inequality between countries has improved, yet income inequality within countries has become worse. Today, 71 percent of the world’s population live in countries where inequality has grown. This is especially important because inequalities within countries are the inequalities people feel day to day, month to month, year to year. This is how people stack up and compare themselves with their neighbours, family members, and society. Since 1990, income inequality has increased in most developed countries and in some middle-income countries, including China and India.
While inequality has gone up in the majority of countries over the past three decades, it has fallen in a few. In Latin America and the Caribbean, there has been a considerable decline, although levels remain high. In Africa and Asia, trends have been more varied, with greater similarities between emerging economies or landlocked developing countries, and between rural or urban areas, than within regions.
The very top
Despite progress in some regions, income and wealth are increasingly concentrated at the top. An Oxfam report shows that in the 10 years since the financial crisis, the number of billionaires has nearly doubled, and the fortunes of the world’s super-rich have reached record levels. In 2018, the 26 richest people in the world held as much wealth as half of the global population (the 3.8 billion poorest people), down from 43 people the year before.
This matters because rapid rises in incomes at the top are driving and exacerbating within country income inequality. From 1990 to 2015, the share of income going to the top 1 per cent of the global population increased in 46 out of 57 countries with data. Meanwhile, in more than half of the 92 countries with data, the bottom 40 per cent receive less than 25 per cent of overall income.
In your society, who you are, matters
There are also inequalities within communities – and even families. Up to 30 per cent of income inequality is due to inequality within households. When it comes to women and girls, progress is uneven. In many ways gender inequalities have been shrinking – the gender pay gap, for instance, has decreased for some women in certain occupations over the last couple of decades. However, at the same time, women and girls put in 12.5 billion hours of unpaid care work each and every day — a contribution to the global economy of at least $10.8 trillion a year, more than three times the size of the global tech industry.
Groups such as indigenous peoples, migrants and refugees, and ethnic and other minorities continue to suffer from discrimination, marginalisation, and lack of legal rights. This is pervasive across developing and developed countries alike and is not tied to income. For example, social protection has been significantly extended globally, yet persons with disabilities are up to five times more likely than average to incur catastrophic health expenditures. Additionally, a UNDESA report found that at the current rate of progress observed from the 1990s to the 2010s, it will take more than four decades to close the stunting gap between ethnic groups.
More than income
The measurements and impacts of inequality go far beyond income and purchasing power. Inequalities of opportunity affect a person’s life expectancy and access to basic services such as healthcare, education, water, and sanitation. They can curtail a person’s human rights, through discrimination, abuse and lack of access to justice. In 2018, we saw the world’s 12th consecutive year of decline in global freedom, with 71 countries suffering net declines in political and civil liberties.
High levels of inequality of opportunity discourage skills accumulation, choke economic and social mobility, and human development and, consequently, depress economic growth. It also entrenches uncertainty, vulnerability and insecurity, undermines trust in institutions and government, increases social discord and tensions and trigger violence and conflicts. There are growing evidence that high level of income and wealth inequality is propelling the rise of nativism and extreme forms of nationalism.
In addition, the evolution of issues such as climate change, technology, and urbanisation raise urgent policy challenges. For example, climate change is exacerbating environmental degradation, increasing the frequency and intensity of extreme weather events, and by no means impacting people uniformly. If climate change continues unaddressed it will increase inequality within countries and may even reverse current progress in reducing inequality between countries. Meanwhile, technology can be a great equaliser – by enhancing connectivity, financial inclusion, access to trade and public services, for instance – but those yet to be connected may experience further marginalisation as a result, especially as progress is slowing, even reversing, among some constituencies. With a global trend toward urbanisation, cities are becoming a growing site for inequalities. They find high levels of wealth and modern infrastructure coexist with pockets of severe deprivation, often side by side. This makes gaping and increasing levels of inequality all the more glaring within cities.
Tackling inequalities
Rising inequality is not the only way forward. For example, between 2010 and 2016, the incomes of the poorest 40 percent of the population grew faster than those of the entire population in 60 out of 94 countries with data. This shows inequality is neither inevitable nor irreversible.
There is a clear need to pursue inclusive, equitable, and sustainable growth, ensuring a balance among economic, social, and environmental dimensions of sustainable development. However, inequality takes many forms and varies significantly across countries. While Goal 10 of the Sustainable Development Goals (SDG 10) and its targets provide a framework, the fight against inequality must be rooted in country-contexts, economic imperatives, and political realities. There is no scope for a one-size fits all approach, and national policies and institutions matter.
FOR MORE INFORMATION
UNDESA | World Social Report 2020 Inequality in a Rapidly Changing World
UNDP | Human Development Report 2019
UNDP | Global Multidimensional Poverty Index
UN University | World Income Inequality Database
World Bank | Poverty and Shared Prosperity 2016
PDF VERSION
un75_inequality.pdf
Inequality in the United States
Press enter to search
Facts
Income Inequality in the United States
Gaps in earnings between America’s most affluent and the rest of the country continue to grow year after year.
Income Inequality
In the United States, the income gap between the rich and everyone else has been growing markedly, by every major statistical measure, for more than 30 years.
Income Inequality
Wage Inequality
Racial Income Inequality
CEO-Worker Pay Gaps
Income Inequality
Income includes the revenue streams from wages, salaries, interest on a savings account, dividends from shares of stock, rent, and profits from selling something for more than you paid for it. Unlike wealth statistics, income figures do not include the value of homes, stock, or other possessions. Income inequality refers to the extent to which income is distributed in an uneven manner among a population.
https://public.tableau.com/views/CBOIncomeBeforeTaxesandTransfers1979-2021/Dashboard1?:embed=y&:showVizHome=no&:host_url=https%3A%2F%2Fpublic.tableau.com%2F&:embed_code_version=3&:tabs=no&:toolbar=yes&:animate_transition=yes&:display_static_image=no&:display_spinner=no&:display_overlay=yes&:display_count=yes&:language=en-US&publish=yes&:loadOrderID=0
Over the past four decades, the richest 1 percent of Americans have enjoyed by far the fastest income growth. The most rapid increase has occurred at the tippy top of the economic ladder. Between 1979 and 2021, the average income of the richest 0.01 percent of households, a group that today represents just over 12,000 households, grew nearly 27 times as fast as the income of the bottom 20 percent of earners. These Congressional Budget Office figures include income from labor and investments, and do not account for taxes or means-tested public assistance, such as food stamps or Medicaid.
https://public.tableau.com/views/CBOIncomebyHouseholdPercentile-2021/Dashboard1?:embed=y&:showVizHome=no&:host_url=https%3A%2F%2Fpublic.tableau.com%2F&:embed_code_version=3&:tabs=no&:toolbar=yes&:animate_transition=yes&:display_static_image=no&:display_spinner=no&:display_overlay=yes&:display_count=yes&:language=en-US&publish=yes&:loadOrderID=1
Income disparities are now so pronounced that America’s richest 1 percent of households averaged 139 times as much income as the bottom 20 percent in 2021, according to the Congressional Budget Office.
https://public.tableau.com/views/AmericanHasBecomeStarklyMoreUnequal/Dashboard1?:embed=y&:showVizHome=no&:host_url=https%3A%2F%2Fpublic.tableau.com%2F&:embed_code_version=3&:tabs=no&:toolbar=yes&:animate_transition=yes&:display_static_image=no&:display_spinner=no&:display_overlay=yes&:display_count=yes&:loadOrderID=2
The U.S. income divide has not always been as vast as it is today. In response to the staggering inequality of the Gilded Age in the early 1900s, social movements and progressive policymakers fought successfully to level down the top through fair taxation and level up the bottom through increased unionization and other reforms. But beginning in the 1970s, these levelers started to erode and the country returned to extreme levels of inequality. According to data analyzed by UC Berkeley economist Emmanuel Saez, the ratio between the average income of the top 0.1 percent and the bottom 90 percent reached Gilded Age levels in the years preceding the 2008 financial crisis.
https://public.tableau.com/views/Top1IncomeSharevsPoverty/Dashboard1?:embed=y&:showVizHome=no&:host_url=https%3A%2F%2Fpublic.tableau.com%2F&:embed_code_version=3&:tabs=no&:toolbar=yes&:animate_transition=yes&:display_static_image=no&:display_spinner=no&:display_overlay=yes&:display_count=yes&:language=en-US&publish=yes&:loadOrderID=3
Since 1970, the top 1 percent of American earners have enjoyed a 10 percentage point increase in their share of national income, according to figures in the World Inequality Database. Meanwhile, the Census Bureau’s “official” poverty rate for all U.S. families has declined by merely 1.8 points. In 2011, the Census Bureau began publishing a “supplemental” poverty measure that is more accurate but still likely understates the number of people in the world’s richest country who have to struggle to make ends meet. Federal pandemic relief legislation significantly reduced child poverty rates, but those programs were temporary.
https://public.tableau.com/views/IncomeConcentrationHasReturnedtoGildedAgeLevels-2020/Dashboard2?:embed=y&:showVizHome=no&:host_url=https%3A%2F%2Fpublic.tableau.com%2F&:embed_code_version=3&:tabs=no&:toolbar=yes&:animate_transition=yes&:display_static_image=no&:display_spinner=no&:display_overlay=yes&:display_count=yes&:loadOrderID=4
The nation’s highest 0.01 percent and 0.1 percent of income-earners have seen their incomes rise much faster than the rest of the top 1 percent in recent decades. Both of these ultra-rich groups saw their incomes drop immediately after the financial crashes of 1929 and 2008, but they had a much swifter recovery after the more recent crisis. Income concentration today is as extreme as it was during the “Roaring Twenties.”
https://public.tableau.com/views/CBOIncomegrowthaftertaxes-1979-2021/Dashboard1?:embed=y&:showVizHome=no&:host_url=https%3A%2F%2Fpublic.tableau.com%2F&:embed_code_version=3&:tabs=no&:toolbar=yes&:animate_transition=yes&:display_static_image=no&:display_spinner=no&:display_overlay=yes&:display_count=yes&:language=en-US&:loadOrderID=5
Congressional Budget Office data show that taxes and means-tested public assistance narrow the income divide somewhat, but the gaps remain staggering. Between 1979 and 2021, the richest 0.01 percent of households had a cumulative income growth rate of 1,003 percent after accounting for taxes and aid transfers. That’s 7.6 times the 132 percent growth rate for the bottom 20 percent. Tax cuts for the rich are a key driver of this rising inequality. The top U.S. marginal tax rate in 1979 was 70 percent, compared to just 37 percent in 2021. Pandemic programs such as the expanded child tax credit boosted after-tax income for poorer families in 2021, but those programs have since expired.
https://public.tableau.com/views/IncomefromCapitalGains-updatedMarch2025/Dashboard1?:embed=y&:showVizHome=no&:host_url=https%3A%2F%2Fpublic.tableau.com%2F&:embed_code_version=3&:tabs=no&:toolbar=yes&:animate_transition=yes&:display_static_image=no&:display_spinner=no&:display_overlay=yes&:display_count=yes&:language=en-US&:loadOrderID=6
The rich also benefit immensely from the tax code’s preferential treatment of income from investments. Americans who are not among the ultra-rich get the vast majority of their income from wages and salaries. But the higher the U.S. income group, IRS data show, the larger the share of income derived from investment profits. The top tax rate for long-term capital gains is just 20 percent, compared to the top marginal tax rate on ordinary income of 37 percent.
Wage Inequality
https://public.tableau.com/views/AverageAnnualWages1980-2022/Dashboard1?:embed=y&:showVizHome=no&:host_url=https%3A%2F%2Fpublic.tableau.com%2F&:embed_code_version=3&:tabs=no&:toolbar=yes&:animate_transition=yes&:display_static_image=no&:display_spinner=no&:display_overlay=yes&:display_count=yes&:language=en-US&publish=yes&:loadOrderID=7
Between 1980 and 2022, the bottom 90 percent of U.S. earners had wage growth of just 36 percent, compared to 162 percent for the richest 1 percent and 301 percent for the top 0.1 percent, according to Economic Policy Institute analysis of Social Security Administration data. Those in the top income groups did experience a decline in 2022. This reflects that year’s weak stock market, since this wage data includes income from stock options, a common form of compensation for corporate elites. But with the market surges in 2023 and 2024, this was no doubt a short-term dip for the richest Americans.
https://public.tableau.com/views/ProductivityvsPay1948-2024/Dashboard1?:embed=y&:showVizHome=no&:host_url=https%3A%2F%2Fpublic.tableau.com%2F&:embed_code_version=3&:tabs=no&:toolbar=yes&:animate_transition=yes&:display_static_image=no&:display_spinner=no&:display_overlay=yes&:display_count=yes&:language=en-US&publish=yes&:loadOrderID=8
During the decades after World War II, worker productivity and wages rose at approximately the same consistent rate. But since the 1970s, workers have no longer reaped the same rewards from productivity gains. From 1979 to 2024, average hourly compensation increased just 29.4 percent (after adjusting for inflation) while worker productivity increased 80.9 percent, according to the Economic Policy Institute. In other words, productivity grew at a rate 2.7 times as fast as worker pay.
https://public.tableau.com/views/AsUnionsDeclineInequalityBecomesMoreExtreme427/Dashboard1?:embed=y&:showVizHome=no&:host_url=https%3A%2F%2Fpublic.tableau.com%2F&:embed_code_version=3&:tabs=no&:toolbar=yes&:animate_transition=yes&:display_static_image=no&:display_spinner=no&:display_overlay=yes&:display_count=yes&:language=en-US&:loadOrderID=9
One factor in the widening income divide is the decline of U.S. labor unions. The share of the workforce represented by a union has declined to just 10.1 percent in 2022, down from over 30 percent in the 1940s and 1950s. Meanwhile, those at the top of the income scale have increased their power to rig economic rules in their favor, further increasing income inequality. In 2018, the richest 1% earned over 20 percent of all national income.
https://public.tableau.com/views/UnionVSNonUnionmedianweeklyearnings/Dashboard1?:embed=y&:showVizHome=no&:host_url=https%3A%2F%2Fpublic.tableau.com%2F&:embed_code_version=3&:tabs=no&:toolbar=yes&:animate_transition=yes&:display_static_image=no&:display_spinner=no&:display_overlay=yes&:display_count=yes&:language=en-US&:loadOrderID=10
U.S. workers who are unionized continue to earn significantly higher wages than their non-unionized counterparts, according to Bureau of Labor Statistics data. The gap is particularly wide among women. In 2022, median weekly wages for full-time unionized women amounted to $1,232 — $216 more than non-unionized women’s earnings.
https://public.tableau.com/views/WomenmakeupasmallpercentageoftopU_S_earners/WomenmakeupasmallpercentageoftopU_S_earner?:embed=y&:showVizHome=no&:host_url=https%3A%2F%2Fpublic.tableau.com%2F&:embed_code_version=3&:tabs=no&:toolbar=yes&:animate_transition=yes&:display_static_image=no&:display_spinner=no&:display_overlay=yes&:display_count=yes&publish=yes&:loadOrderID=11
Men make up an overwhelming majority of top earners across the U.S. economy, even though women now represent almost half of the country’s workforce. According to analysis by Thomas Piketty, Emmanuel Saez, and Gabriel Zucman, women comprise just 27 percent of the top 10 percent, and their share of higher income groups runs even smaller. Among the top 1 percent, women make up slightly less than 17 percent of workers, while at the top 0.1 percent level, they make up only 11 percent.
https://public.tableau.com/views/WallStreetBonusesvsMinWage1995-2024/Dashboard1?:embed=y&:showVizHome=no&:host_url=https%3A%2F%2Fpublic.tableau.com%2F&:embed_code_version=3&:tabs=no&:toolbar=yes&:animate_transition=yes&:display_static_image=no&:display_spinner=no&:display_overlay=yes&:display_count=yes&:language=en-US&:loadOrderID=12
Since 1995, the average Wall Street bonus has increased 491 percent, from $41,400 to $244,700 in 2024 (not adjusted for inflation). If the minimum wage had increased at that same rate, it would be worth $20.87 today, instead of $7.25. The total 2024 bonus pool for 201,500 New York City-based Wall Street employees was $47.5 billion — a record high, and enough to pay for more than 1 million jobs paying $15 per hour for a year. Because the very rich can squirrel away much of their income, huge Wall Street bonuses don’t have nearly the stimulus effect as raising pay for low-wage workers who have to spend nearly every dollar they make. The sharp rise in Wall Street bonuses has also contributed to race and gender inequality.
Racial Income Inequality
https://public.tableau.com/views/BlackandLatinorepresentation-CEOsminwagelaborforce-2022/Dashboard1?:embed=y&:showVizHome=no&:host_url=https%3A%2F%2Fpublic.tableau.com%2F&:embed_code_version=3&:tabs=no&:toolbar=yes&:animate_transition=yes&:display_static_image=no&:display_spinner=no&:display_overlay=yes&:display_count=yes&:language=en-US&:loadOrderID=13
In 2021, Fortune 500 CEOs, who earned $18.3 million on average, included just four Black and 17 Latino people — just 4 percent of the total. By contrast, these groups made up 43 percent of the U.S. workers who would benefit from a raise in the federal minimum wage to $15 per hour by 2025, according to Institute for Policy Studies analysis of Economic Policy Institute data. Black and Latino people comprise 31 percent of the entire U.S. labor force.
https://public.tableau.com/views/PersistentPovertybyRace/Dashboard1?:embed=y&:showVizHome=no&:host_url=https%3A%2F%2Fpublic.tableau.com%2F&:embed_code_version=3&:tabs=no&:toolbar=yes&:animate_transition=yes&:display_static_image=no&:display_spinner=no&:display_overlay=yes&:display_count=yes&:language=en-US&:loadOrderID=14
The world’s wealthiest country is home to numerous communities that have been poor for generations: think parts of Appalachia, the Mississippi Delta, the southern border, and Chicago’s South Side. An Economic Innovation Group report finds that people of color are far more likely to live in “persistently poor” communities – defined as those with poverty rates of 20 percent or higher for at least 30 years – than white Americans.
https://public.tableau.com/views/WeeklyEarningsbyRace-updatedNov2023/Dashboard1?:embed=y&:showVizHome=no&:host_url=https%3A%2F%2Fpublic.tableau.com%2F&:embed_code_version=3&:tabs=no&:toolbar=yes&:animate_transition=yes&:display_static_image=no&:display_spinner=no&:display_overlay=yes&:display_count=yes&:language=en-US&publish=yes&:loadOrderID=15
Racial discrimination in many forms, including in education, hiring, and pay practices, contributes to persistent earnings gaps. As of the third quarter of 2023, the median white worker made 24 percent more than the typical Black worker and around 28 percent more than the median Latino worker, according to BLS data.
https://public.tableau.com/views/MonthlyUnemploymentRace2010-2025-updated32025/Dashboard1?:embed=y&:showVizHome=no&:host_url=https%3A%2F%2Fpublic.tableau.com%2F&:embed_code_version=3&:tabs=no&:toolbar=yes&:animate_transition=yes&:display_static_image=no&:display_spinner=no&:display_overlay=yes&:display_count=yes&:language=en-US&:loadOrderID=16
The Black unemployment rate has persistently run about twice as high as for white workers. These rates only count those who are actively seeking work, leaving out those who have given up finding a job. While racial gaps have narrowed somewhat in recent years, the divides remain wide. In February 2025, Black unemployment stood at 6.0 percent, compared to 3.8 percent for white workers, according to BLS data.
https://public.tableau.com/views/AverageWageinIndustrieswithLargeUndocumentedPopulations/Dashboard1?:embed=y&:showVizHome=no&:host_url=https%3A%2F%2Fpublic.tableau.com%2F&:embed_code_version=3&:tabs=no&:toolbar=yes&:animate_transition=yes&:display_static_image=no&:display_spinner=no&:display_overlay=yes&:display_count=yes&:language=en-US&publish=yes&:loadOrderID=17
Undocumented immigrants make up an estimated 4.9 percent of the U.S. workforce, with Mexicans making up by far the largest share. Institute for Policy Studies analysis of BLS data illustrates that occupations with large undocumented workforces pay far less than the average annual wage. For example, agricultural workers, an estimated 15.1 percent of whom are undocumented, make an average of $37,370 annually, considerably less than the $65,470 average for all U.S. occupations. And because so many undocumented workers live in the shadows, even these figures likely overestimate their actual wages.
CEO-Worker Pay Gaps
CEO pay has been a key driver of rising U.S. income inequality for decades, and the gap between CEO and worker pay only widened during the pandemic.
https://public.tableau.com/views/CEOPaySoaredWhileRealWorkerWagesDroppedin2021/Dashboard1?:embed=y&:showVizHome=no&:host_url=https%3A%2F%2Fpublic.tableau.com%2F&:embed_code_version=3&:tabs=no&:toolbar=yes&:animate_transition=yes&:display_static_image=no&:display_spinner=no&:display_overlay=yes&:display_count=yes&:language=en-US&:loadOrderID=18
In 2021, corporate CEOs were quick to blame worker wages for causing inflation. But an AFL-CIO analysis reveals that workers’ real wages actually fell 2.4 percent in 2021 after adjusting for inflation. Meanwhile, S&P 500 companies increased their CEO pay by an average of 18.2 percent while enjoying record profits and spending a record $882 billion on stock buybacks.
https://public.tableau.com/views/CEOvWorkerPayComponents-2023/Dashboard1?:embed=y&:showVizHome=no&:host_url=https%3A%2F%2Fpublic.tableau.com%2F&:embed_code_version=3&:tabs=no&:toolbar=yes&:animate_transition=yes&:display_static_image=no&:display_spinner=no&:display_overlay=yes&:display_count=yes&:language=en-US&publish=yes&:loadOrderID=19
Corporate boards lavish wildly complex compensation packages on their top executives, mostly in various forms of stock-based pay. The objective? To give the impression of a “pay for performance” system that aligns the interests of CEOs and shareholders. By contrast, ordinary American workers receive nearly all of their compensation in the form of cash salary or wages. In the chart above, we’ve added to the BLS median annual wage a bonus worth 2.3 percent and an employer 401(k) contribution worth 3 percent of base pay.
https://public.tableau.com/views/Top10BuybackSpendersandCEOpayratio-2023/Dashboard1?:embed=y&:showVizHome=no&:host_url=https%3A%2F%2Fpublic.tableau.com%2F&:embed_code_version=3&:tabs=no&:toolbar=yes&:animate_transition=yes&:display_static_image=no&:display_spinner=no&:display_overlay=yes&:display_count=yes&:language=en-US&:loadOrderID=20
In reality, the notion that Corporate America has a CEO “pay for performance” system is a myth. One common ploy for inflating CEO pay? Stock buybacks. This financial maneuver siphons funds from worker wages while artificially pumping up the value of CEO stock-based pay. The Institute for Policy Studies Executive Excess 2023 report examines buyback activity among the 100 S&P 500 corporations with the lowest median wages. Between January 1, 2020, and May 31, 2023, fully 90 percent of these firms spent company resources on buybacks, for a total expenditure of $341 billion. During their stock buyback spree, the value of CEOs’ personal stock holdings at these “Low-Wage 100” firms increased more than three times as fast as their median worker pay.
null
During the pandemic, corporate boards took explicit actions to shield their CEOs’ massive paychecks while workers were suffering. An Institute for Policy Studies analysis found that more than half of the 100 S&P 500 companies with the lowest median worker pay moved bonus goalposts or otherwise rigged rules to inflate CEO pay in 2020. Among these rule-rigging corporations, CEO compensation averaged $15.3 million, up 29 percent from 2019. Median worker pay ran $28,187 on average, 2 percent lower than the 2019 worker pay rate. The ratio between CEO and median worker pay at these 51 firms averaged 830 to 1.
null
With U.S. unions playing a smaller economic role, the gap between worker and CEO pay has exploded since the early 1990s. In 1980, the average big company CEO earned just 42 times as much as the average U.S. worker. In 2021, the CEO-worker pay gap was nearly eight times larger than in 1980. According to the AFL-CIO, S&P 500 firm CEOs were paid 324 times as much as average U.S. workers in 2021. CEO pay averaged $18.3 million, compared to average worker pay of $58,260. During the 21st century, the annual gap between CEO pay and typical worker pay has averaged about 350 to 1.
null
The CEO pay explosion, as shown in AFL-CIO analysis, contrasts sharply with trends at the bottom end of the U.S. wage scale. Average CEO pay at S&P 500 corporations is up 642 percent since 1991, while Congress has not passed a minimum wage increase for more than a decade. The federal minimum wage for restaurant servers and other tipped workers has been frozen at just $2.13 per hour since 1991. According to the Labor Department, 27 states have raised their tipped minimum, while retaining this two-tier system. Seven states and the District of Columbia have eliminated or are phasing out the subminimum tipped wage altogether, while in Michigan the issue was tied up in the courts as of December 2022. In six states, the tipped minimum is still $2.13. While employers are technically supposed to make up the difference if workers don’t earn enough in tips to reach the $7.25 federal minimum, this rule is largely unenforced.
Stay informed
Subscribe to our weekly newsletter
Inequality.org is a project of the Institute for Policy Studies
Content licensed under a Creative Commons 3.0 LicenseSite by Wide Eye Creative
Trends in U.S. income and wealth inequality | Pew Research Center
https://www.pewresearch.org/social-trends/2020/01/09/trends-in-income-and-wealth-inequality/
Home Research Topics Economy & Work Income, Wealth & Poverty Economic Inequality
- Report
|
January 9, 2020
Most Americans Say There Is Too Much Economic Inequality in the U.S., but Fewer Than Half Call It a Top Priority
1. Trends in income and wealth inequality
ByJuliana Menasce Horowitz,Ruth IgielnikandRakesh Kochhar
Table of Contents
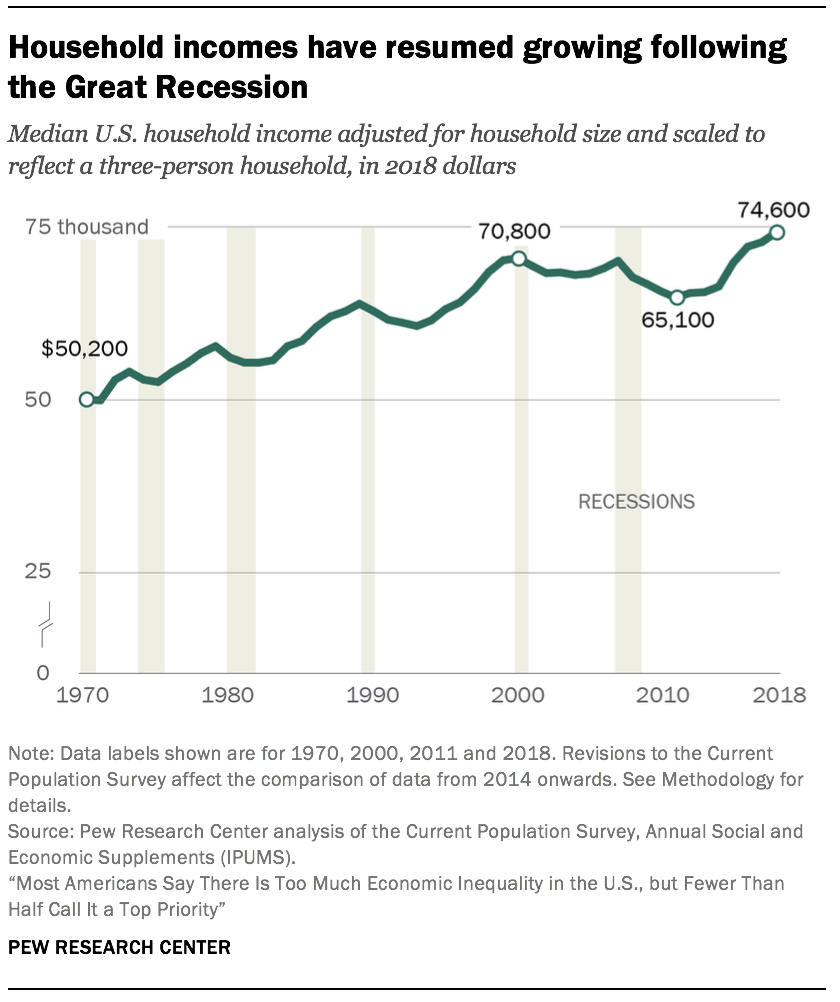
Barely 10 years past the end of the Great Recession in 2009, the U.S. economy is doing well on several fronts. The labor market is on a job-creating streak that has rung up more than 110 months straight of employment growth, a record for the post-World War II era. The unemployment rate in November 2019 was 3.5%, a level not seen since the 1960s. Gains on the jobs front are also reflected in household incomes, which have rebounded in recent years.
But not all economic indicators appear promising. Household incomes have grown only modestly in this century, and household wealth has not returned to its pre-recession level. Economic inequality, whether measured through the gaps in income or wealth between richer and poorer households, continues to widen.
Household incomes are growing again after a lengthy period of stagnation
With periodic interruptions due to business cycle peaks and troughs, the incomes of American households overall have trended up since 1970. In 2018, the median income of U.S. households stood at $74,600.5 This was 49% higher than its level in 1970, when the median income was $50,200.6 (Incomes are expressed in 2018 dollars.)
But the overall trend masks two distinct episodes in the evolution of household incomes (the first lasting from 1970 to 2000 and the second from 2000 to 2018) and in how the gains were distributed.
Most of the increase in household income was achieved in the period from 1970 to 2000. In these three decades, the median income increased by 41%, to $70,800, at an annual average rate of 1.2%. From 2000 to 2018, the growth in household income slowed to an annual average rate of only 0.3%. If there had been no such slowdown and incomes had continued to increase in this century at the same rate as from 1970 to 2000, the current median U.S. household income would be about $87,000, considerably higher than its actual level of $74,600.
The shortfall in household income is attributable in part to two recessions since 2000. The first recession, lasting from March 2001 to November 2001, was relatively short-lived.7 Yet household incomes were slow to recover from the 2001 recession and it was not until 2007 that the median income was restored to about its level in 2000.
But 2007 also marked the onset of the Great Recession, and that delivered another blow to household incomes. This time it took until 2015 for incomes to approach their pre-recession level. Indeed, the median household income in 2015 – $70,200 – was no higher than its level in 2000, marking a 15-year period of stagnation, an episode of unprecedented duration in the past five decades.8
More recent trends in household income suggest that the effects of the Great Recession may finally be in the past. From 2015 to 2018, the median U.S. household income increased from $70,200 to $74,600, at an annual average rate of 2.1%. This is substantially greater than the average rate of growth from 1970 to 2000 and more in line with the economic expansion in the 1980s and the dot-com bubble era of the late 1990s.
Why economic inequality matters
Alternative estimates of economic inequality
Upper-income households have seen more rapid growth in income in recent decades
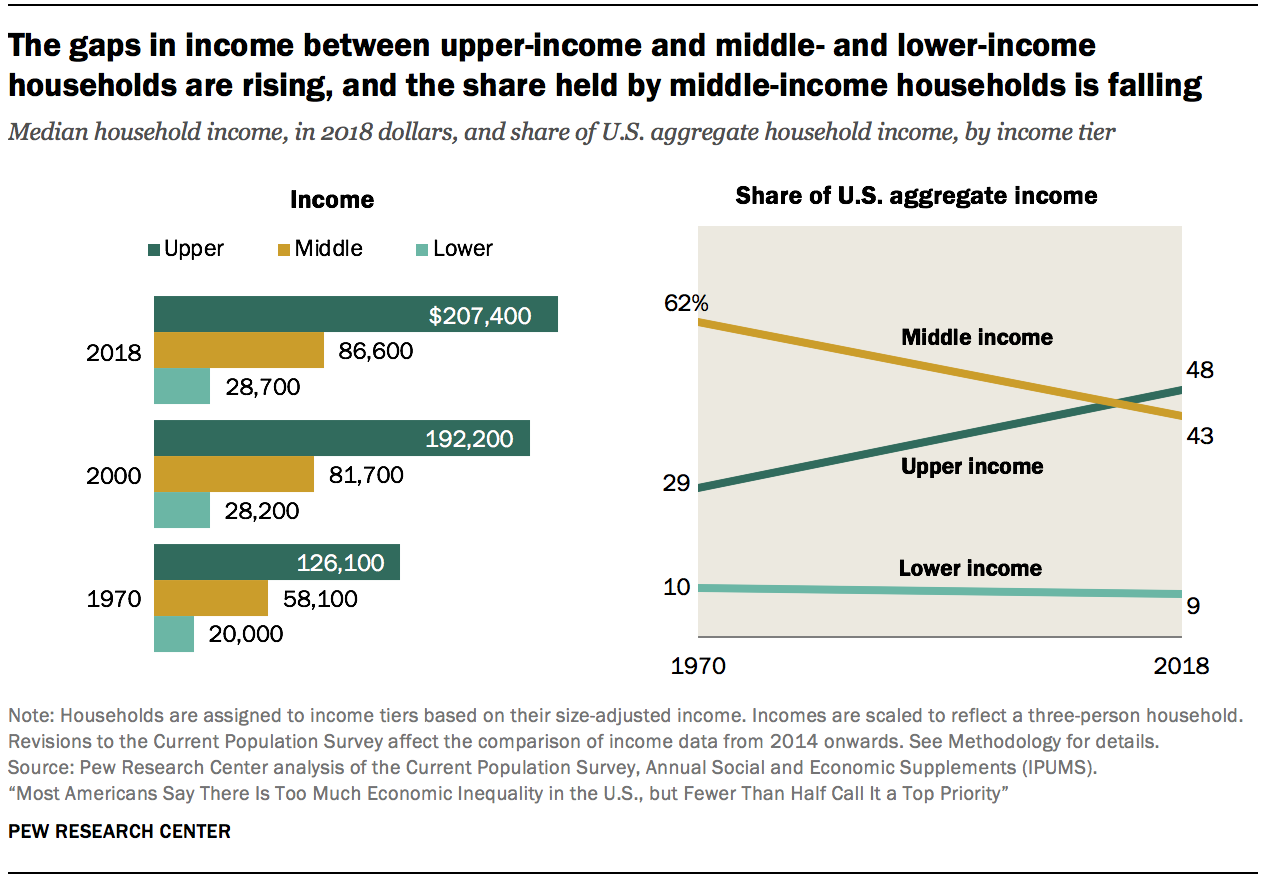
The growth in income in recent decades has tilted to upper-income households. At the same time, the U.S. middle class, which once comprised the clear majority of Americans, is shrinking. Thus, a greater share of the nation’s aggregate income is now going to upper-income households and the share going to middle- and lower-income households is falling.9
The share of American adults who live in middle-income households has decreased from 61% in 1971 to 51% in 2019. This downsizing has proceeded slowly but surely since 1971, with each decade thereafter typically ending with a smaller share of adults living in middle-income households than at the beginning of the decade.
The decline in the middle-class share is not a total sign of regression. From 1971 to 2019, the share of adults in the upper-income tier increased from 14% to 20%. Meanwhile, the share in the lower-income tier increased from 25% to 29%. On balance, there was more movement up the income ladder than down the income ladder.
But middle-class incomes have not grown at the rate of upper-tier incomes. From 1970 to 2018, the median middle-class income increased from $58,100 to $86,600, a gain of 49%.10 This was considerably less than the 64% increase for upper-income households, whose median income increased from $126,100 in 1970 to $207,400 in 2018. Households in the lower-income tier experienced a gain of 43%, from $20,000 in 1970 to $28,700 in 2018. (Incomes are expressed in 2018 dollars.)
More tepid growth in the income of middle-class households and the reduction in the share of households in the middle-income tier led to a steep fall in the share of U.S. aggregate income held by the middle class. From 1970 to 2018, the share of aggregate income going to middle-class households fell from 62% to 43%. Over the same period, the share held by upper-income households increased from 29% to 48%. The share flowing to lower-income households inched down from 10% in 1970 to 9% in 2018.
These trends in income reflect the growth in economic inequality overall in the U.S. in the decades since 1980.
Income growth has been most rapid for the top 5% of families
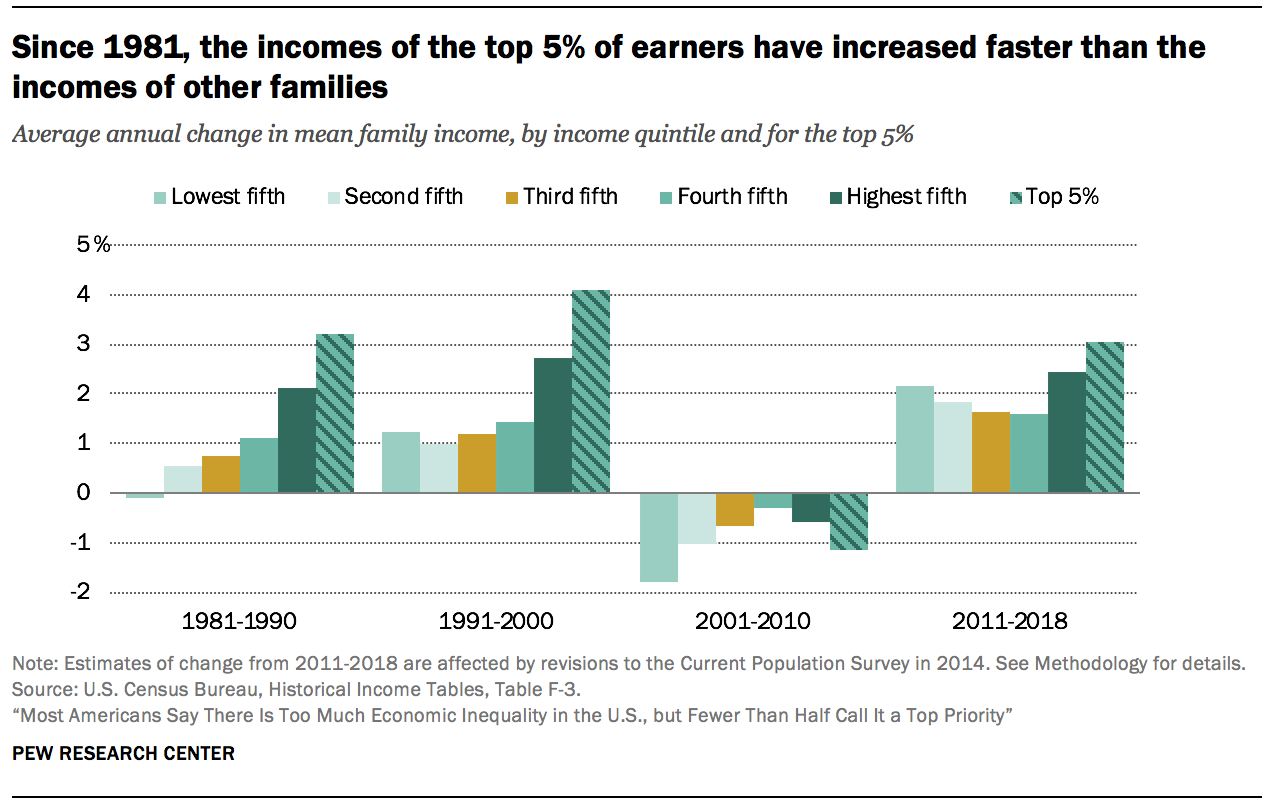
Even among higher-income families, the growth in income has favored those at the top. Since 1980, incomes have increased faster for the most affluent families – those in the top 5% – than for families in the income strata below them. This disparity in outcomes is less pronounced in the wake of the Great Recession but shows no signs of reversing.
From 1981 to 1990, the change in mean family income ranged from a loss of 0.1% annually for families in the lowest quintile (the bottom 20% of earners) to a gain of 2.1% annually for families in the highest quintile (the top 20%). The top 5% of families, who are part of the highest quintile, fared even better – their income increased at the rate of 3.2% annually from 1981 to 1990. Thus, the 1980s marked the beginning of a long and steady rise in income inequality.
A similar pattern prevailed in the 1990s, with even sharper growth in income at the top. From 1991 to 2000, the mean income of the top 5% of families grew at an annual average rate of 4.1%, compared with 2.7% for families in the highest quintile overall, and about 1% or barely more for other families.
The period from 2001 to 2010 is unique in the post-WWII era. Families in all strata experienced a loss in income in this decade, with those in the poorer strata experiencing more pronounced losses. The pattern in income growth from 2011 to 2018 is more balanced than the previous three decades, with gains more broadly shared across poorer and better-off families. Nonetheless, income growth remains tilted to the top, with families in the top 5% experiencing greater gains than other families since 2011.
The wealth of American families is currently no higher than its level two decades ago
Other than income, the wealth of a family is a key indicator of its financial security. Wealth, or net worth, is the value of assets owned by a family, such as a home or a savings account, minus outstanding debt, such as a mortgage or student loan. Accumulated over time, wealth is a source of retirement income, protects against short-term economic shocks, and provides security and social status for future generations.
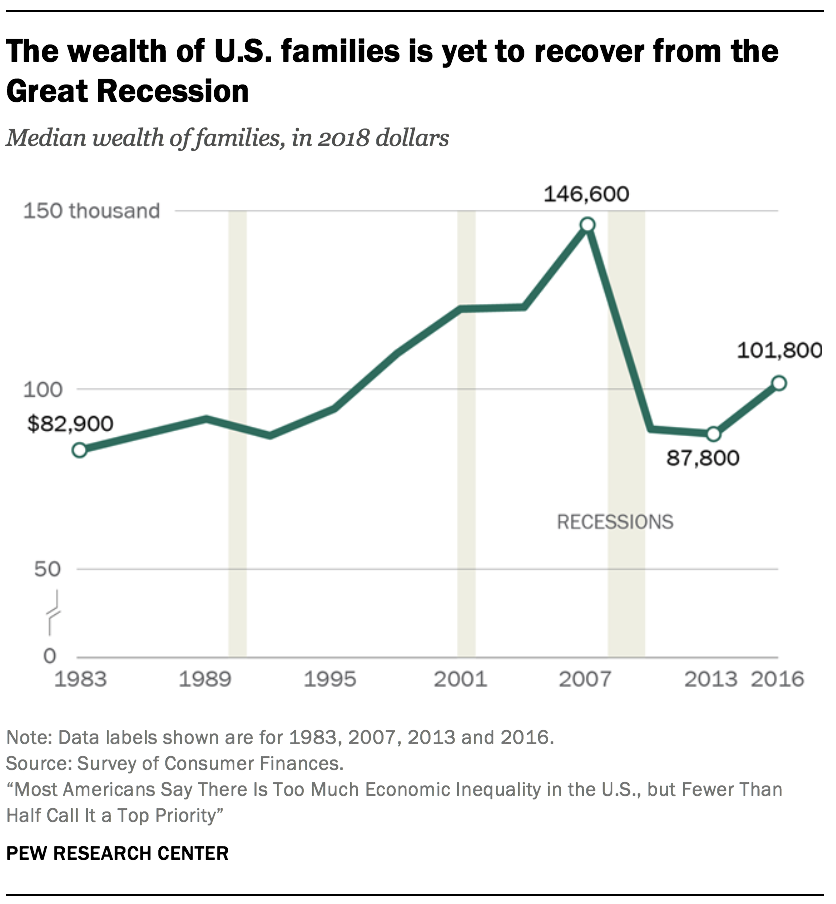
The period from the mid-1990s to the mid-2000s was beneficial for the wealth portfolios of American families overall. Housing prices more than doubled in this period, and stock values tripled.11 As a result, the median net worth of American families climbed from $94,700 in 1995 to $146,600 in 2007, a gain of 55%.12 (Figures are expressed in 2018 dollars.)
But the run up in housing prices proved to be a bubble that burst in 2006. Home prices plunged starting in 2006, triggering the Great Recession in 2007 and dragging stock prices into a steep fall as well. Consequently, the median net worth of families fell to $87,800 by 2013, a loss of 40% from the peak in 2007. As of 2016, the latest year for which data are available, the typical American family had a net worth of $101,800, still less than what it held in 1998.
The wealth divide among upper-income families and middle- and lower-income families is sharp and rising
The wealth gap among upper-income families and middle- and lower-income families is sharper than the income gap and is growing more rapidly.
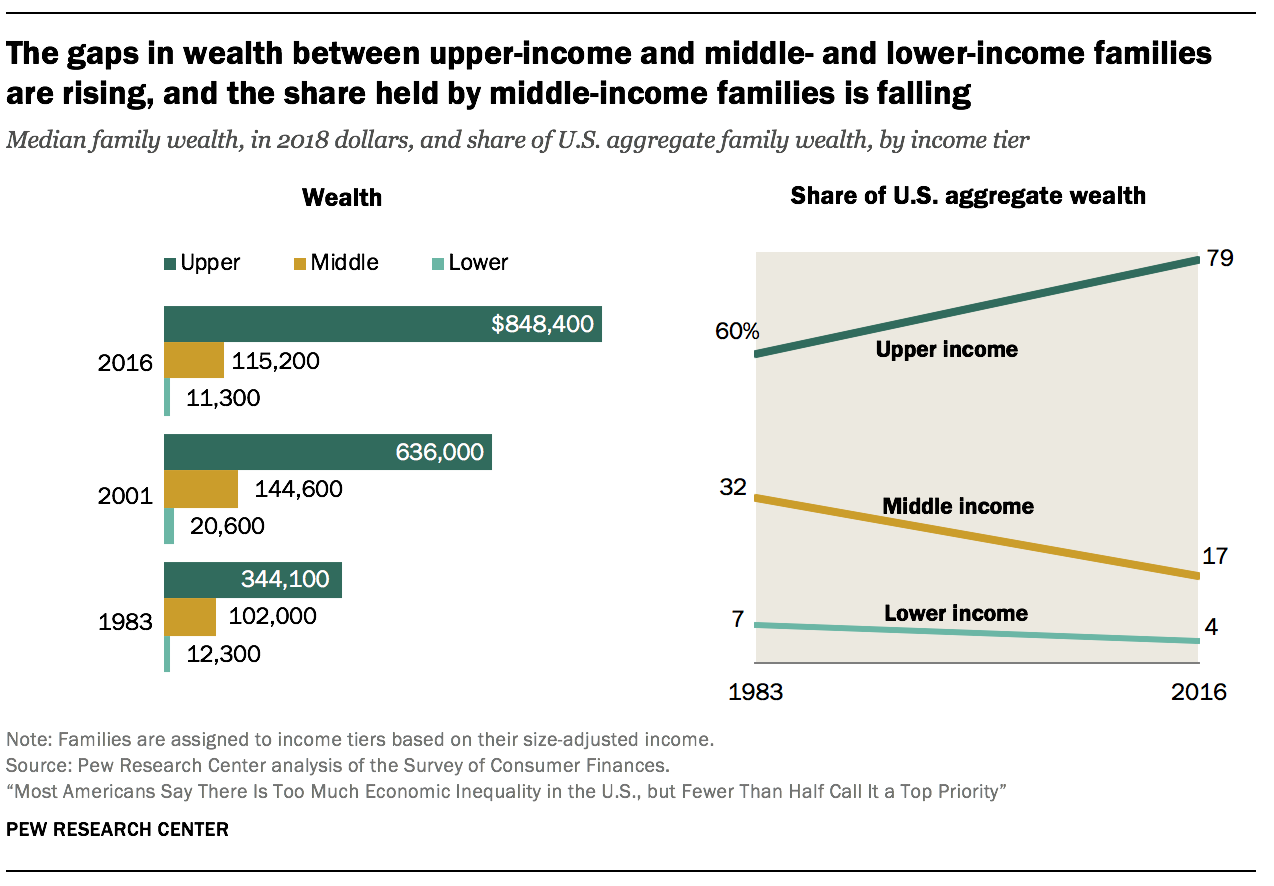
The period from 1983 to 2001 was relatively prosperous for families in all income tiers, but one of rising inequality. The median wealth of middle-income families increased from $102,000 in 1983 to $144,600 in 2001, a gain of 42%. The net worth of lower-income families increased from $12,3oo in 1983 to $20,600 in 2001, up 67%. Even so, the gains for both lower- and middle-income families were outdistanced by upper-income families, whose median wealth increased by 85% over the same period, from $344,100 in 1983 to $636,000 in 2001. (Figures are expressed in 2018 dollars.)
The wealth gap between upper-income and lower- and middle-income families has grown wider this century. Upper-income families were the only income tier able to build on their wealth from 2001 to 2016, adding 33% at the median. On the other hand, middle-income families saw their median net worth shrink by 20% and lower-income families experienced a loss of 45%. As of 2016, upper-income families had 7.4 times as much wealth as middle-income families and 75 times as much wealth as lower-income families. These ratios are up from 3.4 and 28 in 1983, respectively.
The reason for this is that middle-income families are more dependent on home equity as a source of wealth than upper-income families, and the bursting of the housing bubble in 2006 had more of an impact on their net worth. Upper-income families, who derive a larger share of their wealth from financial market assets and business equity, were in a better position to benefit from a relatively quick recovery in the stock market once the recession ended.
As with the distribution of aggregate income, the share of U.S. aggregate wealth held by upper-income families is on the rise. From 1983 to 2016, the share of aggregate wealth going to upper-income families increased from 60% to 79%. Meanwhile, the share held by middle-income families has been cut nearly in half, falling from 32% to 17%. Lower-income families had only 4% of aggregate wealth in 2016, down from 7% in 1983.
The richest are getting richer faster
The richest families in the U.S. have experienced greater gains in wealth than other families in recent decades, a trend that reinforces the growing concentration of financial resources at the top.
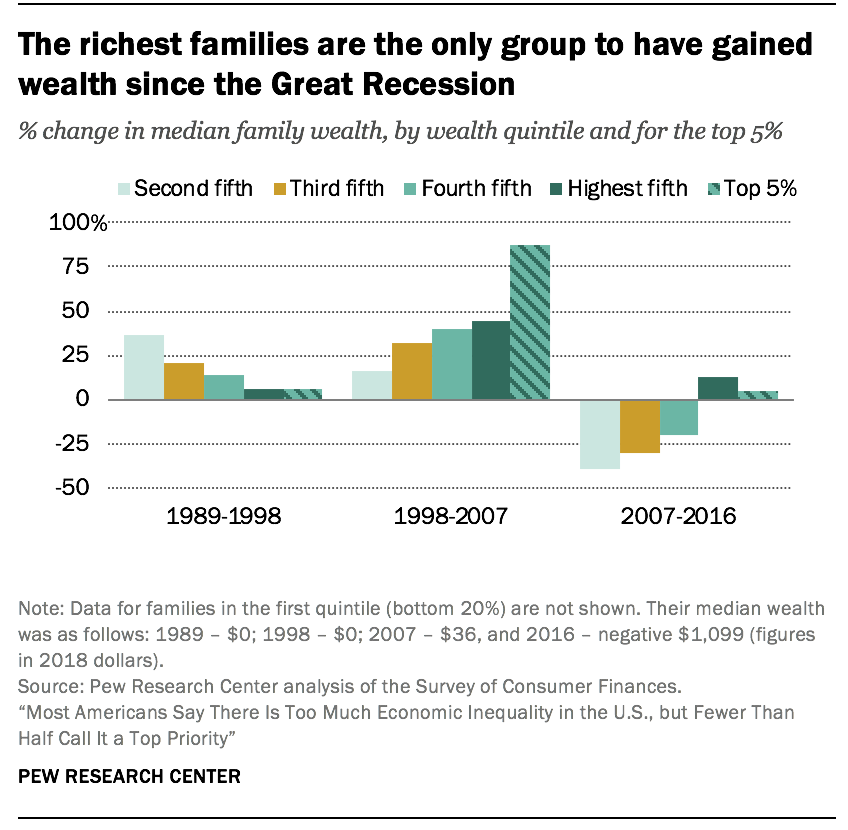
The tilt to the top was most acute in the period from 1998 to 2007. In that period, the median net worth of the richest 5% of U.S. families increased from $2.5 million to $4.6 million, a gain of 88%.
This was nearly double the 45% increase in the wealth of the top 20% of families overall, a group that includes the richest 5%. Meanwhile, the net worth of families in the second quintile, one tier above the poorest 20%, increased by only 16%, from $27,700 in 1998 to $32,100 in 2007. (Figures are expressed in 2018 dollars.)
The wealthiest families are also the only ones to have experienced gains in wealth in the years after the start of the Great Recession in 2007. From 2007 to 2016, the median net worth of the richest 20% increased 13%, to $1.2 million. For the top 5%, it increased by 4%, to $4.8 million. In contrast, the net worth of families in lower tiers of wealth decreased by at least 20% from 2007 to 2016. The greatest loss – 39% – was experienced by the families in the second quintile of wealth, whose wealth fell from $32,100 in 2007 to $19,500 in 2016.
As a result, the wealth gap between America’s richest and poorer families more than doubled from 1989 to 2016. In 1989, the richest 5% of families had 114 times as much wealth as families in the second quintile, $2.3 million compared with $20,300. By 2016, this ratio had increased to 248, a much sharper rise than the widening gap in income.13
Income inequality in the U.S has increased since 1980 and is greater than in peer countries
Income inequality may be measured in a number of ways, but no matter the measure, economic inequality in the U.S. is seen to be on the rise.
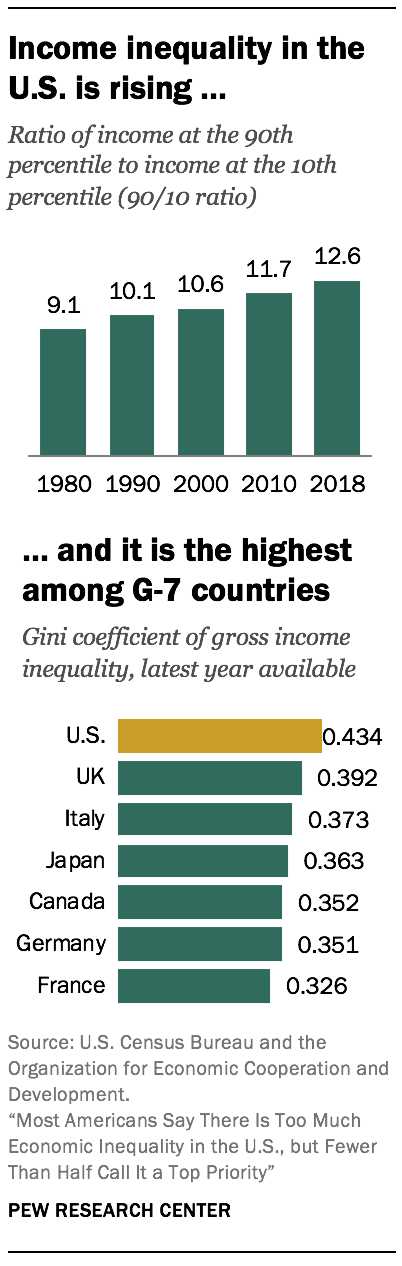
One widely used measure – the 90/10 ratio – takes the ratio of the income needed to rank among the top 10% of earners in the U.S. (the 90th percentile) to the income at the threshold of the bottom 10% of earners (the 10th percentile). In 1980, the 90/10 ratio in the U.S. stood at 9.1, meaning that households at the top had incomes about nine times the incomes of households at the bottom. The ratio increased in every decade since 1980, reaching 12.6 in 2018, an increase of 39%.14
Not only is income inequality rising in the U.S., it is higher than in other advanced economies. Comparisons of income inequality across countries are often based on the Gini coefficient, another commonly used measure of inequality.15 Ranging from 0 to 1, or from perfect equality to complete inequality, the Gini coefficient in the U.S. stood at 0.434 in 2017, according to the Organization for Economic Cooperation and Development (OECD).16 This was higher than in any other of the G-7 countries, in which the Gini ranged from 0.326 in France to 0.392 in the UK, and inching closer to the level of inequality observed in India (0.495). More globally, the Gini coefficient of inequality ranges from lows of about 0.25 in Eastern European countries to highs in the range of 0.5 to 0.6 in countries in southern Africa, according to World Bank estimates.
Next: Views of economic inequality
- The median income splits the income distribution into two halves – half the households earn less than the median and half the households earn more. Incomes are adjusted for household size and scaled to represent a household size of three. See methodology for details.↩
- Percentage changes are estimated, and other calculations are made, before numbers are rounded.↩
- The recession dates are as designated by the National Bureau of Economic Research.↩
- It is likely that household incomes did not return to their 2000 level till 2016 or later. A redesign of income questionsby the Census Bureau in 2014 is estimated to have given a boost of about 3% to median household income in the U.S. at the time of the redesign.↩
- Middle-income” Americans are adults whose annual household income is two-thirds to double the national median, after incomes have been adjusted for household size. Lower-income households have incomes less than 67% of the median and upper-income households have incomes that are more than double the median. See methodology for details. Previous Pew Research Center reports have examined the state of the American middle class in greater detail, including trends within U.S. metropolitan areas.↩
- The data source for these estimates is the Current Population Survey, Annual Social and Economic Supplement for 1971 to 2019. In the survey, respondents provide household income data for the previous calendar year. Thus, income data in this section refer to the 1970-2018 period and the counts of people from the same survey refer to the 1971-2019 period.↩
- The S&P/Case-Shiller U.S. National Home Price Index increased from 80 in January 1995 to 185 in June 2006 (January 2000=100). It fell to 134 in February 2012 and climbed thereafter, reaching 212 in August 2019. At the start of the Great Recession in December 2007, the S&P 500 index stood at about 1,500, three times its level of about 500 in 1995. After the peak in 2007, the S&P 500 fell below 1,000 in 2009. As of November 2019, the index had reached a level of about 3,000. (S&P 500 historical values downloaded from Yahoo! on Nov. 21, 2019.)↩
- Estimates of wealth are from the Survey of Consumer Finances (SCF). The SCF is conducted triennially by the Federal Reserve Board of Governors. It was first fielded in 1983 and the latest survey for which data are available was in 2016.↩
- It is not possible to compute the ratio of the wealth of the top 5% of families to the wealth of the poorest 20% because the median wealth of the poorest families is either zero or negative in most years examined.↩
- Per the U.S. Census Bureau, the source of these estimates, the 90th percentile household income in 2018 was $184,292 and the 10th percentile household income was $14,629 (incomes not adjusted for household size).↩
- The Gini coefficient encapsulates the share of aggregate income held by each person or household. If everyone has the same income, or the same share of aggregate income, the Gini coefficient equals zero. If the income distribution is perfectly unequal, a single person or household holds all aggregate income, the Gini coefficient is equal to one.↩
- The OECD is a group of 36 countries, including many of the world’s advanced economies. The OECD’s estimates of the Gini coefficient are for the following years: U.S. – 2017, UK – 2017, Italy – 2016, Japan – 2015, Canada – 2017, Germany – 2016, France – 2016, and India – 2011.↩

Sign up for our weekly newsletter
Fresh data delivered Saturday mornings
Topics
Related
Economic Inequality Seen as Major Challenge Around the World
Income inequality is greater among Chinese Americans than any other Asian origin group in the U.S.
1 in 10: Redefining the Asian American Dream (Short Film)
The Hardships and Dreams of Asian Americans Living in Poverty
A booming U.S. stock market doesn’t benefit all racial and ethnic groups equally
Most Popular
1The Experiences of LGBTQ Americans Today
2Trump’s Job Rating Drops, Key Policies Draw Majority Disapproval as He Nears 100 Days
3Bluesky has caught on with many news influencers, but X remains popular
4Biden granted more acts of clemency than any prior president
5Support for stricter environmental regulations outweighs opposition in a majority of states
Report Materials
901 E St. NW, Suite 300
Washington, DC 20004
USA
(+1) 202-419-4300 | Main
(+1) 202-857-8562 | Fax
(+1) 202-419-4372 | Media Inquiries
Research Topics
Follow Us
ABOUT PEW RESEARCH CENTER Pew Research Center is a nonpartisan, nonadvocacy fact tank that informs the public about the issues, attitudes and trends shaping the world. It does not take policy positions. The Center conducts public opinion polling, demographic research, computational social science research and other data-driven research. Pew Research Center is a subsidiary of The Pew Charitable Trusts, its primary funder.
© 2025 Pew Research Center
9.3A: Class Structure in the U.S. – Social Sci LibreTexts
Apathy/Apathetic – Word of Truth Ministries
https://www.wordoftruthministries.org/terms-and-definitions/apathyapathetic/

Home Terms and Definitions Apathy/Apathetic
Apathy/Apathetic
C. S. Craig March 17, 2014Terms and Definitions
Apathy: Lack of interest or concern, especially regarding Scripture. In the believer, apathy occurs when we choose to think independently of God. When this occurs, sins goes on and on, and remains unconfessed. The result is carnality or carnal thinking and activities (worldliness).
When the believer is carnal (out of fellowship) the believer acts and thinks just like the unbeliever. Continuous sin and prolonged indifference (apathy) causes scar tissue to build up on the soul, which causes hardening of the heart. In extreme conditions this leads to the sin unto death (God takes you out of this life), when God can no longer use the believer because of maximum negative volition.
When the believer is in carnality, he/she is “grieving and quenching the Holy Spirit.” Quenching the Spirit is the absence of the Holy Spirit’s mentorship. Grieving the Holy Spirit is the absence of the empowerment of the Holy Spirit.
Apathy is living in the flesh – controlled by the flesh, as in addictions and lust-patterns – blown to and fro by the trends of the world instead of being grounded in the Word. Apathy is human-viewpoint thinking. Apathy is indifference to the call (conviction) of the Holy Spirit (quenching). Apathy is thinking independently of God, which was actually the first sin of satan, the fallen angels who sided with satan, and Eve and Adam. Apathy is literally a repeat of the original sin so that all mankind is guilty of rejecting God in favor of self-rule.
Please note: In the Church Age we have a new commandment that replaces the Mosaic Law: “Be (keep on being) filled with the Spirit” (Ephesians 5:18 cf., Matthew 22:6; Galatians 5:22-23).
Spirituality and carnality are absolutes (Ephesians 4:30; 1 Thessalonians 5:19; 1 John 1:7; 2:10; 3:49). The believer is either spiritual (filled with the Spirit – in fellowship, controlled by the Holy Spirit) or carnal (out of fellowship, controlled by your sin nature – the flesh – quenching and grieving the Holy Spirit).
When the believer is filled with the Holy Spirit, the Holy Spirit produces Divine Good through you, and Jesus Christ is glorified. When the believer is carnal/out of fellowship, he/she produces human good. Spirituality and carnality are basic concepts of experiential Christianity.
Happy Studying!
The preceding explanations are reproduced here, from RBT Bible Ministries’ book “OLD SIN NATURE vs. THE HOLY SPIRIT” (used with permission).
Related Studies:
- Search for:Search
- Site Navigation
- Study Categories
- Family Thoughts (21)
- Meditations (85)
- Poetry (85)
- Storybook Nursery Rhymes (5)
- Terms and Definitions (232)
- Thoughts to Ponder Series (95)
- Tree of Knowledge (246)
- Recent Posts
- The Center of Change
- Revelation and Reason
- Thoughts to Ponder in Your Walk with the Lord (Part Ninety-Five)
- Thoughts to Ponder in Your Walk with the Lord (Part Ninety-Four)
- Walking Through Holy Week
- Thoughts to Ponder in Your Walk with the Lord (Part Ninety-Three)
- Thoughts to Ponder in Your Walk with the Lord (Part Ninety-Two)
- Thoughts to Ponder in Your Walk with the Lord (Part Ninety-One)
- Thoughts to Ponder in Your Walk with the Lord (Part Ninety)
- Thoughts to Ponder in Your Walk with the Lord (Part Eighty-Nine)
- Thoughts to Ponder in Your Walk with the Lord (Part Eighty-Eight)
- Thoughts to Ponder in Your Walk with the Lord (Part Eighty-Seven)
- Critical, Doctrinal Points of God’s Grace
- Greed, Depravity, and Judgment
- Thoughts to Ponder in Your Walk with the Lord (Part Eighty-Six)
- God’s Deliverance
- Expressing the Inexpressible
- Thoughts to Ponder in Your Walk with the Lord (Part Eighty-Five)
- Thoughts to Ponder in Your Walk with the Lord (Part Eighty-Four)
- Cogitation and Meaning
- ArchivesArchives Select Month May 2025 (3) April 2025 (1) March 2025 (4) February 2025 (8) January 2025 (22) December 2024 (29) November 2024 (9) October 2024 (11) September 2024 (21) August 2024 (30) July 2024 (71) June 2024 (5) May 2024 (1) May 2023 (2) February 2023 (1) January 2023 (4) December 2022 (1) November 2022 (2) August 2022 (2) May 2022 (1) February 2022 (4) September 2021 (1) June 2021 (1) May 2021 (2) March 2021 (3) February 2021 (2) January 2021 (9) November 2020 (1) October 2020 (5) September 2020 (2) July 2020 (1) June 2020 (1) May 2020 (1) April 2020 (10) March 2020 (3) August 2019 (1) July 2019 (1) June 2019 (2) April 2019 (1) December 2018 (2) October 2018 (3) September 2018 (1) August 2018 (1) July 2018 (1) May 2018 (6) April 2018 (1) March 2018 (1) January 2018 (2) December 2017 (3) November 2017 (6) October 2017 (1) September 2017 (2) August 2017 (5) July 2017 (3) June 2017 (18) May 2017 (6) April 2017 (7) March 2017 (2) December 2016 (1) November 2016 (6) October 2016 (2) September 2016 (1) June 2016 (3) April 2016 (3) March 2016 (1) January 2016 (1) November 2015 (1) October 2015 (4) September 2015 (3) August 2015 (3) June 2015 (2) May 2015 (6) April 2015 (1) March 2015 (3) December 2014 (3) November 2014 (1) September 2014 (1) July 2014 (6) June 2014 (1) May 2014 (7) April 2014 (14) March 2014 (288) November 2009 (1) October 2005 (1) April 2004 (1) March 2004 (1)
- Search for:Search
Powered by Tempera & WordPress.
Economic Inequality

Menu
Want to create or adapt books like this? Learn more about how Pressbooks supports open publishing practices.
Book Contents NavigationContents
Introduction to Sociology: Understanding and Changing the Social World
Economic Inequality and Poverty in the United States
Learning Objectives
- Understand trends in U.S. inequality.
- Explain the social distribution of U.S. poverty.
- Distinguish the structural and individual explanations of poverty.
- List the major effects of poverty.
In his classic book The Other America, Michael Harrington (1962) brought the reality of poverty home to many Americans. In chapter after chapter, he discussed the troubled lives of the poor in rural Appalachia, in our urban centers, and in other areas of the country, and he indicted the country for not helping the poor. His book helped kindle interest in the White House and Congress in aiding the poor and deeply affected its thousands of readers. Almost five decades later, we know much more about poverty than we used to. Despite initial gains in fighting poverty in the 1960s (Schwartz, 1984), poverty is still with us and has worsened since the early 2000s, especially since the onset of the serious economic recession that began in 2008. What do we know about the extent of poverty, the reasons for it, and its consequences?
Economic Inequality
The United States has a very large degree of economic inequality. A common way to examine inequality is to rank the nation’s families by income from lowest to highest and then to divide this distribution into fifths. Thus, we have the poorest fifth of the nation’s families (or the 20% of families with the lowest family incomes), a second fifth with somewhat higher incomes, and so on until we reach the richest fifth of families, or the 20% with the highest incomes. We then can see what percentage each fifth has of the nation’s entire income. Figure 8.6 “Share of National Income Going to Income Fifths, 2016” shows such a calculation for the United States. The poorest fifth enjoys only 3.8% of the nation’s income, while the richest fifth enjoys 53.2%. Another way of saying this is that the richest 20% of the population have as much income as the remaining 80% of the population.
Figure 8.6 Share of National Income Going to Income Fifths, 2016
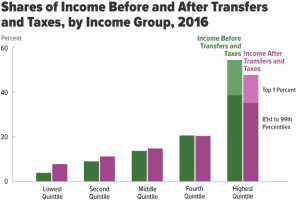
Source: Data from Congressional Budget Office.
This degree of inequality is the largest in the industrialized world. Figure 8.7 “Income Inequality Around the World” compares the inequality among several industrialized nations by dividing the median income of households in the 90th percentile (meaning they have more income than 90% of all households) by the median income of households in the 10th percentile (meaning they have more income than only 10% of all households); the higher the resulting ratio, the greater a nation’s inequality. The ratio for the United States, 4.86, far exceeds that for any other nation.
Figure 8.7 Income Inequality Around the World

Ratio of median income of richest 10% in each nation to that of poorest 10%.
Source: Data from Mishel, L., Bernstein, J., & Shierholz, H. (2009). The state of working America 2008/2009. Ithaca, NY: ILR Press [An imprint of Cornell University Press].
Economic inequality in the United States has increased during the last two decades. The loss of manufacturing jobs and changes in taxation and income distribution policies since the early 1980s have favored the rich and hurt the economic standing of the middle class and the poor (Barlett & Steele, 2002; Wilson, 2009). After adjusting for inflation, the post-tax income of the nation’s wealthiest families grew by a much greater amount than that for the poorest families from 1979 to 2005. It grew by only 6% for the poorest fifth but by 80% for the wealthiest fifth, and it also grew by a whopping 228% for families in the top 1% of the nation’s families (Mishel, Bernstein, & Shierholz, 2009). As the saying goes, the rich get richer. To recall our earlier discussion, to be upwardly mobile, it helps to be well-off to begin with.
Poverty
When U.S. officials became concerned about poverty during the 1960s, they quickly realized they needed to find out how much poverty we had. To do so, a measure of official poverty, or a poverty line, was needed. This line was first calculated in 1963 by Mollie Orshansky who proposed determining the poverty line by multiplying the cost of a very minimal diet by three, as a 1955 government study had determined that the typical American family spent one-third of its income on food. Thus a family whose income is lower than three times the cost of a very minimal diet is considered officially poor.

The measure of official poverty began in 1963 and stipulates that a family whose income is lower than three times the cost of a minimal diet is considered officially poor. This measure has not changed since 1963 even though family expenses have risen greatly in many areas.
Bill Herndon – Katrina Leftovers 1 – CC BY-NC-ND 2.0.
This way of calculating the poverty line has not changed since 1963, even though many other things, such as energy, child care, and health care, now occupy a greater percentage of the typical family’s budget than was true in 1963. As a national measure, the poverty line also fails to take into account regional differences in the cost of living. For all of these reasons, many experts think the official measurement of poverty is highly suspect. As a recent report observed, “Most poverty analysts strongly believe that the official poverty statistics are inadequate to the task of determining who is poor in America” (Mishel, Bernstein, & Shierholz, 2009, p. 298).
The poverty line is adjusted annually for inflation and takes into account the number of people in a family: the larger the family size, the higher the poverty line. In 2018, the poverty line for a nonfarming family of four (two adults, two children) was $25,100. A four-person family earning even one more dollar than $25,100 in 2018 was not officially poor, even though its “extra” income hardly lifted it out of dire economic straits. Policy experts have calculated a no-frills budget that enables a family to meet its basic needs in food, clothing, shelter, and so forth; this budget is about twice the poverty line. Families with incomes between the poverty line and twice the poverty line are barely making ends meet, but they are not considered officially poor. When we talk here about the poverty level, keep in mind that we are talking only about official poverty and that there are many families and individuals living in near-poverty who have trouble meeting their basic needs, especially when they face unusually high medical or motor vehicle expenses or the like. For this reason, some analyses use “twice-poverty” data (i.e., family incomes below twice the poverty line) to provide a more accurate understanding of how many Americans face serious financial difficulties.
The Extent and Social Distribution of Poverty
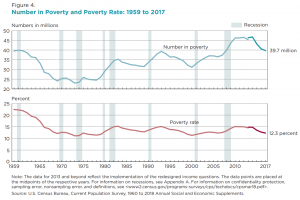
With this caveat in mind, how many Americans are poor, and who are they? The U.S. Census Bureau gives us some answers. In 2009, 14.3% of the U.S. population, or almost 44 million Americans, lived in (official) poverty (DeNavas-Walt, Proctor, & Smith, 2010). This percentage represented a decline from the early 1990s but was higher than the rate in the late 1960s (see Figure 8.8 “U.S. Poverty, 1959–2017”). If we were winning the war on poverty in the 1960s, since then poverty has fought us to a standstill.
Figure 8.8 U.S. Poverty, 1959–2017
Source: Data from U.S. Census Bureau. (2017). Historical poverty tables: People. Retrieved from http://www.census.gov/hhes/www/poverty/data/historical/people.html.
Another way of understanding the extent of poverty is to consider episodic poverty, defined by the Census Bureau as being poor for at least 2 consecutive months in some time period. From 2004 to 2007, the last years for which data are available, almost one-third of the U.S. public, equal to about 95 million people, were poor for at least 2 consecutive months, although only 2.2% were poor for all 3 years (DeNavas-Walt, Proctor, & Smith, 2010). As these figures indicate, people go into and out of poverty, but even those who go out of it do not usually move very far from it.
Learning From Other Societies
Poverty and Poverty Policy in Other Western Democracies
To compare international poverty rates, scholars commonly use a measure of the percentage of households in a nation that receive less than half of the nation’s median household income after taxes and cash transfers from the government. In 2000, the latest date for which data are available, 17% of U.S. households lived in poverty as defined by this measure (Mishel, Bernstein, & Shierholz, 2009). By comparison, selected other Western democracies had the following rates (Mishel, Bernstein, & Shierholz, 2009, p. 384):Canada11.4%Denmark9.2%France8.0%Germany8.3%Norway6.4%Spain14.3%Sweden6.5%United Kingdom12.4%
The average poverty rate of Western democracies excluding the United States is 9.8%. The U.S. rate is thus 1.73 times greater than this average.
Why is there so much more poverty in the United States than in its Western counterparts? Several differences between the United States and the other nations stand out. First, other Western nations have higher minimum wages and stronger unions than the United States has, and these lead to incomes that help push people above poverty. Second, the other nations spend a much greater proportion of their gross domestic product on social expenditures (income support and social services such as child care subsidies and housing allowances) than does the United States. As a recent analysis concluded,
Other peer countries are much more likely than the United States to step in where markets have failed to live their most disadvantaged citizens out of poverty. This suggests that the relatively low expenditures on social welfare are at least partially implicated in the high poverty rates in the United States. (Mishel, Bernstein, & Shierholz, 2009, p. 387)
In short, the United States has so much more poverty than other democracies in part because it spends so much less than they do on helping the poor. The United States certainly has the wealth to follow their example, but it has chosen not to do so, and a high poverty rate is the unfortunate result.
Who are the poor? Contrary to popular images, the most typical poor person in the United States is white: approximately 44% of poor people are white (non-Latino), 29% are Latino, 23% are black, and 4% are Asian (see Figure 8.9 “Racial and Ethnic Composition of the Poor, 2009 (Percentage of Poor Persons in Each Group)”). At the same time, race and ethnicity affect the chances of being poor: while only 9.4% of non-Latino whites are poor, 25.8% of African Americans, 12.5% of Asians, and 25.3% of Latinos (who may be of any race) are poor (see Figure 8.10 “Race, Ethnicity, and Poverty, 2009 (Percentage of Each Group That Is Poor)”). Thus African Americans and Latinos are almost three times as likely as non-Latino whites to be poor. (Because there are so many non-Latino whites in the United States, the plurality of poor people are non-Latino white, even if the percentage of whites who are poor is relatively low.) Chapter 10 “Race and Ethnicity” further discusses the link between poverty and race and ethnicity.
Figure 8.9 Racial and Ethnic Composition of the Poor, 2009 (Percentage of Poor Persons in Each Group)

Source: Data from DeNavas-Walt, C., Proctor, B. D., & Smith, J. C. (2010). Income, poverty, and health insurance coverage in the United States: 2009 (Current Population Report P60-238). Washington, DC: U.S. Census Bureau.
Figure 8.10 Race, Ethnicity, and Poverty, 2009 (Percentage of Each Group That Is Poor)

Source: Data from U.S Census Bureau Current Population Survey. (2008). POV01: Age and sex of all people, family members and unrelated individuals iterated by income-to-poverty ratio and race. Retrieved from http://www.census.gov/hhes/www/macro/032008/pov/new01_100.htm.
Turning to age, almost 21% of children under age 18 are poor (amounting to more than 15 million children), including 35.7% of African American children and 33.1% of Latino children (DeNavas-Walt, Proctor, & Smith, 2010). The poverty rate for U.S. children is the highest in the Western world and 1.5 to 9 times greater than the corresponding rates in Canada and Western Europe (Mishel, Bernstein, & Shierholz, 2009). At the other end of the age distribution, 8.9% of people aged 65 or older are poor (amounting to about 3.4 million seniors). Turning around these U.S. figures, about 36% of all poor people in the United States are children, and about 8% of the poor are 65 or older. Thus some 44% of Americans living in poverty are children or the elderly.

The poverty rate for U.S. children is the highest in the Western world.
Wikimedia Commons – CC BY-SA 3.0.
The type of family structure also makes a difference: whereas only 8.5% of children living with married parents live in poverty, 43% of those living with only their mother live in poverty (2007 data). This latter figure is about 32% for Asian children and for non-Latino white children and rises to slightly more than 50% for African American children and Latino children (Moore, Redd, Burkhauser, Mbawa, & Collins, 2009). As these latter numbers indicate, families headed by a single woman are much more likely to be poor. Poverty thus has a female face.
Explaining Poverty
Explanations of poverty focus on problems either within the poor themselves or in the society in which they live (Iceland, 2006). The first type of explanation follows logically from the functional theory of stratification and may be considered an “individual” explanation. The second type of explanation follows from conflict theory and is a structural explanation that focuses on problems in American society that produce poverty. As the “Sociology Making a Difference” box discusses, the explanation of poverty people favor affects how sympathetic they are to the poor.
According to the individual explanation, the poor have personal problems and deficiencies that are responsible for their poverty. In the past, the poor were thought to be biologically inferior, a view that has not entirely faded, but today the much more common belief is that they lack the ambition and motivation to work hard and to achieve. According to the World Values Survey, 60% of Americans believe that people are poor “because they are lazy and lack will power.” This percentage reflects the tendency of Americans to favor individual explanations of poverty (Davidson, 2009).
A more sophisticated version of this type of explanation is called the culture of poverty theory (Banfield, 1974; O. Lewis, 1966). According to this theory, the poor generally have beliefs and values that differ from those of the nonpoor and that doom them to continued poverty. For example, they are said to be impulsive and to live for the present rather than the future. Critics say this view exaggerates the degree to which the poor and nonpoor do in fact hold different values and ignores discrimination and other problems in American society (Iceland, 2006).
According to the second, structural explanation, U.S. poverty stems from problems in American society that lead to lack of equal opportunity. These problems include (a) racial, ethnic, gender, and age discrimination; (b) lack of good schooling and adequate health care; and (c) structural changes in the American economic system, such as the departure of manufacturing companies from American cities in the 1980s and 1990s (Iceland, 2003). These problems help create a vicious cycle of poverty in which children of the poor are often fated to end up in poverty or near-poverty themselves as adults.
Sociology Making a Difference
Attributions for Poverty and Public Education Campaigns
The text discusses two general explanations for poverty. The first attributes poverty to lack of willpower and other problems among the poor themselves, while the second attributes poverty to structural obstacles and lack of opportunity in the larger society. As the text notes, Americans tend to favor the first explanation more than the second explanation. They also tend to disagree that the government should do more to help the poor. Could these two sets of views be linked? If so, what would such a link imply for poverty policy?
Sociological research finds that the explanation we favor for poverty—the attribution for poverty we hold—affects whether we want the government to take an active role in helping the poor (Bradley & Cole, 2002). People who attribute poverty to problems in the larger society are much more likely than those who attribute it to deficiencies among the poor to believe that the government should take such a role. The attribution for poverty we hold presumably affects the amount of sympathy we have for the poor, and our sympathy, or lack of sympathy, in turn affects our views about the government’s role in helping the poor. As sociologist Theresa C. Davidson (2009) observes, “Beliefs about the causes of poverty shape attitudes toward the poor.”
This body of research strongly suggests that public support for government aid for the poor is weak because so much of the public attributes poverty to failings among the poor themselves. If so, the public might very well begin to endorse greater government aid if its attribution for poverty became more structural instead of individual. Public education campaigns that call attention to the lack of opportunity and other structural problems that account for poverty thus might further poverty policy by beginning to change public perceptions of the poor.
Most sociologists favor the structural explanation. As our earlier Monopoly example illustrates, poverty greatly blocks opportunities for success. Later chapters document racial and ethnic discrimination, lack of adequate schooling and health care, and other problems that make it difficult to rise out of poverty. On the other hand, some ethnographic research supports the individual explanation by showing that the poor do have certain values and follow certain practices that augment their plight (Small, Harding, & Lamont, 2010). For example, the poor have higher rates of cigarette smoking (34% of people with annual incomes between $6,000 and $11,999 smoke, compared to only 13% of those with incomes $90,000 or greater (Goszkowski, 2008), which helps lead them to have more serious health problems. Adopting an integrated perspective, some researchers say these values and practices are in many ways the result of poverty itself (Small, Harding, & Lamont, 2010). These scholars concede a culture of poverty does exist, but they also say it exists because it helps the poor cope daily with the structural effects of being poor. If these effects lead to a culture of poverty, they add, then poverty becomes self-perpetuating. If poverty is both cultural and structural in origin, these scholars say, a comprehensive national effort must be launched to improve the lives of the people in the “other America.”
The Effects of Poverty
However poverty is explained, it has important and enduring effects, which later chapters will continue to discuss. For now, we can list some of the major consequences of poverty (and near-poverty) in the United States. As we do so, recall the sociological perspective’s emphasis on how our social backgrounds influence our attitudes, behaviors, and life chances. This influence on life chances is quite evident when we look at some of the effects of poverty (Moore, Redd, Burkhauser, Mbawa, & Collins, 2009; Iceland, 2006; D. Lindsey, 2009):

Poor children are more likely to have inadequate nutrition and to experience health, behavioral, and cognitive problems.
Kelly Short – Poverty: “Damaged Child,” Oklahoma City, OK, USA, 1936. (Colorized). – CC BY-SA 2.0.
- The poor are at greater risk for family problems, including divorce and domestic violence. The stress of being poor is thought to be a major reason for these problems.
- The poor are also at greater risk for health problems, including infant mortality, earlier mortality during adulthood, mental illness, and inadequate medical care. Many poor people lack health insurance. Poor children are more likely to have inadequate nutrition and to suffer health, behavioral, and cognitive problems. These problems in turn impair their ability to do well in school and land stable employment as adults, helping to ensure that poverty will persist across generations.
- Poor children typically go to rundown schools with inadequate facilities where they receive inadequate schooling. They are much less likely than nonpoor children to graduate from high school or to go to college. Their lack of education in turn restricts them and their own children to poverty, once again helping to ensure a vicious cycle of continuing poverty across generations.
- The poor are, not surprisingly, more likely to be homeless than the nonpoor but also more likely to live in dilapidated housing and unable to buy their own homes. Many poor families spend more than half their income on rent. The lack of adequate housing for the poor remains a major national problem.
Key Takeaways
- Inequality refers to the gap between the rich and the poor. The United States has a high degree of inequality.
- Although the official poverty line measure has been criticized for several reasons, in 2017 about 12.3% of the U.S. population, or more than 40 million people, were living in official poverty.
- About 18% of U.S. children live in official poverty; this rate is the highest in the Western world.
- Explanations of poverty focus on problems either within the poor themselves or in the society in which they live. These two types of explanations reflect the functionalist and conflict views, respectively.
- Poverty has several important and enduring consequences, including many kinds of health problems.
Self Check
about:blank
Reducing U.S. Poverty: What Sociology Suggests
It is easy to understand why the families in Wichita, Kansas, discussed in the news story that began this chapter might be poor in the middle of a deep economic recession. Yet a sociological understanding of poverty emphasizes its structural basis in bad times and good times alike. Poverty is rooted in social and economic problems of the larger society rather than in the lack of willpower, laziness, or other moral failings of poor individuals themselves. Individuals born into poverty suffer from a lack of opportunity from their first months up through adulthood, and poverty becomes a self-perpetuating, vicious cycle. To the extent a culture of poverty might exist, it is best seen as a logical and perhaps even inevitable outcome of, and adaptation to, the problem of being poor and not the primary force driving poverty itself.
This sort of understanding suggests that efforts to reduce poverty must address first and foremost the structural basis for poverty while not ignoring certain beliefs and practices of the poor that also make a difference. An extensive literature on poverty policy outlines many types of policies and strategies that follow this dual approach (Moore, Redd, Burkhauser, Mbawa, & Collins, 2009; Iceland, 2006; D. Lindsey, 2009; Cancian & Danziger, 2009; Turner & Rawlings, 2005). If these were fully adopted, funded, and implemented, they would offer great promise for reducing poverty. As two poverty experts recently wrote, “We are optimistic that poverty can be reduced significantly in the long term if the public and policymakers can muster the political will to pursue a range of promising antipoverty policies” (Cancian & Danziger, 2009, p. 32). Although a full discussion of these policies is beyond the scope of this chapter, the following measures are commonly cited as holding strong potential for reducing poverty:
- Adopt a national “full employment” policy for the poor, involving federally funded job training and public works programs.
- Increase federal aid for the working poor, including earned income credits and child care subsidies for those with children.
- Establish well-funded early childhood intervention programs, including home visitations by trained professionals, for poor families.
- Improve the schools that poor children attend and the schooling they receive and expand early childhood education programs for poor children.
- Provide better nutrition and health services for poor families with young children.
- Strengthen efforts to reduce teenage pregnancies.
References
Banfield, E. C. (1974). The unheavenly city revisited. Boston, MA: Little, Brown; Lewis, O. (1966). The culture of poverty. Scientific American, 113, 19–25.
Barlett, D. L., & Steele, J. B. (2002). The great American tax dodge: How spiraling fraud and avoidance are killing fairness, destroying the income tax, and costing you. Berkeley: University of California Press.
Bradley, C., & Cole, D. J. (2002). Causal attributions and the significance of self-efficacy in predicting solutions to poverty. Sociological Focus, 35, 381–396.
Cancian, M., & Danziger, S. (2009). Changing poverty and changing antipoverty policies. Ann Arbor: National Poverty Center, University of Michigan.
Davidson, T. C. (2009). Attributions for poverty among college students: The impact of service-learning and religiosity. College Student Journal, 43, 136–144.
DeNavas-Walt, C., Proctor, B. D., & Smith, J. C. (2010). Income, poverty, and health insurance coverage in the United States: 2009 (Current Population Report P60-238). Washington, DC: U.S. Census Bureau.
Goszkowski, R. (2008). Among Americans, smoking decreases as income increases. Retrieved from http://www.gallup.com/poll/105550/among-americans-smoking-decreases-income-increases.aspx.
Harrington, M. (1962). The other America: Poverty in the United States. New York, NY: Macmillan.
Iceland, J. (2003). Dynamics of economic well-being, 1996–1999 (Current Population Report P70–91). Washington, DC: U.S. Census Bureau.
Iceland, J. (2006). Poverty in America: A handbook. Berkeley: University of California Press.
Lindsey, D. (2009). Child poverty and inequality: Securing a better future for America’s children. New York, NY: Oxford University Press.
Mishel, L., Bernstein, J., & Shierholz, H. (2009). The state of working America 2008/2009. Ithaca, NY: ILR Press [An imprint of Cornell University Press].
Moore, K. A., Redd, Z., Burkhauser, M., Mbawa, K., & Collins, A. (2009). Children in poverty: Trends, consequences, and policy options. Washington, DC: Child Trends. Retrieved from http://www.childtrends.org/Files//Child_Trends-2009_04_07_RB_ChildreninPoverty.pdf.
Schwartz, J. E. (1984, June 18). The war we won: How the great society defeated poverty. The New Republic, 18–19.
Small, M. L., Harding, D. J., & Lamont, M. (2010, May). Reconsidering culture and poverty. The Annals of the American Academy of Political and Social Science, 629, 6–27.
Turner, M. A., & Rawlings, L. A. (2005). Overcoming concentrated poverty and isolation: Ten lessons for policy and practice. Washington, DC: The Urban Institute.
Wilson, W. J. (2009). The economic plight of inner-city black males. In E. Anderson (Ed.), Against the wall: Poor, young, black, and male (pp. 55–70). Philadelphia: University of Pennsylvania Press.
Previous: Social Class in the United States
Next: The Nature and Extent of Global Stratification Back to top
License

Introduction to Sociology: Understanding and Changing the Social World Copyright © 2016 by University of Minnesota is licensed under a Creative Commons Attribution-NonCommercial-ShareAlike 4.0 International License, except where otherwise noted.
Share This Book
THE SOCIAL CLASSES OF PEOPLE IN THE UNITED STATES
Menu
Want to create or adapt books like this? Learn more about how Pressbooks supports open publishing practices.
Book Contents NavigationContents
Introduction to Sociology: Understanding and Changing the Social World
Social Class in the United States
Learning Objectives
- Distinguish objective and subjective measures of social class.
- Discuss whether the United States has much vertical social mobility.
Most sociologists define social class as a grouping based on similar social factors like wealth, income, education, and occupation. These factors affect how much power and prestige a person has. Social stratification reflects an unequal distribution of resources. In most cases, having more money means having more power or more opportunities. There is a surprising amount of disagreement among sociologists on the number of social classes in the United States and even on how to measure social class membership. We first look at the measurement issue and then discuss the number and types of classes sociologists have delineated.
Measuring Social Class
We can measure social class either objectively or subjectively. If we choose the objective method, we classify people according to one or more criteria, such as their occupation, education, and/or income. The researcher is the one who decides which social class people are in based on where they stand in regard to these variables. If we choose the subjective method, we ask people what class they think they are in. For example, the General Social Survey asks, “If you were asked to use one of four names for your social class, which would you say you belong in: the lower class, the working class, the middle class, or the upper class?” Figure 8.3 “Subjective Social Class Membership” depicts responses to this question. The trouble with such a subjective measure is that some people say they are in a social class that differs from what objective criteria might indicate they are in. This problem leads most sociologists to favor objective measures of social class when they study stratification in American society.
Figure 8.3 Subjective Social Class Membership

Source: Data from General Social Survey, 2008.
Yet even here there is disagreement between functionalist theorists and conflict theorists on which objective measures to use. Functionalist sociologists rely on measures of socioeconomic status (SES), such as education, income, and occupation, to determine someone’s social class. Sometimes one of these three variables is used by itself to measure social class, and sometimes two or all three of the variables are combined (in ways that need not concern us) to measure social class. When occupation is used, sociologists often rely on standard measures of occupational prestige. Since the late 1940s, national surveys have asked Americans to rate the prestige of dozens of occupations, and their ratings are averaged together to yield prestige scores for the occupations (Hodge, Siegel, & Rossi, 1964). Over the years these scores have been relatively stable. Here are some average prestige scores for various occupations: physician, 86; college professor, 74; elementary school teacher, 64; letter carrier, 47; garbage collector, 28; and janitor, 22.
Despite SES’s usefulness, conflict sociologists prefer different, though still objective, measures of social class that take into account ownership of the means of production and other dynamics of the workplace. These measures are closer to what Marx meant by the concept of class throughout his work, and they take into account the many types of occupations and workplace structures that he could not have envisioned when he was writing during the 19th century.
For example, corporations have many upper-level managers who do not own the means of production but still determine the activities of workers under them. They thus do not fit neatly into either of Marx’s two major classes, the bourgeoisie or the proletariat. Recognizing these problems, conflict sociologists delineate social class on the basis of several factors, including the ownership of the means of production, the degree of autonomy workers enjoy in their jobs, and whether they supervise other workers or are supervised themselves (Wright, 2000).
The American Class Structure
As should be evident, it is not easy to determine how many social classes exist in the United States. Over the decades, sociologists have outlined as many as six or seven social classes based on such things as, once again, education, occupation, and income, but also on lifestyle, the schools people’s children attend, a family’s reputation in the community, how “old” or “new” people’s wealth is, and so forth (Coleman & Rainwater, 1978; Warner & Lunt, 1941). For the sake of clarity, we will limit ourselves to the four social classes included in Figure 8.3 “Subjective Social Class Membership”: the upper class, the middle class, the working class, and the lower class. Although subcategories exist within some of these broad categories, they still capture the most important differences in the American class structure (Gilbert, 2011). The annual income categories listed for each class are admittedly somewhat arbitrary but are based on the percentage of households above or below a specific income level.
The Upper Class
The upper class is considered the top, and only the powerful elite get to see the view from there. In the United States, people with extreme wealth make up 1 percent of the population, and they own one-third of the country’s wealth (Beeghley 2008).

The upper class in the United States consists of about 1% of all households and possesses much wealth, power, and influence.
Steven Martin – Highland Park Mansion – CC BY-NC-ND 2.0.
Money provides not just access to material goods, but also access to a lot of power. As corporate leaders, members of the upper class make decisions that affect the job status of millions of people. As media owners, they influence the collective identity of the nation. They run the major network television stations, radio broadcasts, newspapers, magazines, publishing houses, and sports franchises. As board members of the most influential colleges and universities, they influence cultural attitudes and values. As philanthropists, they establish foundations to support social causes they believe in. As campaign contributors, they sway politicians and fund campaigns, sometimes to protect their own economic interests.
U.S. society has historically distinguished between “old money” (inherited wealth passed from one generation to the next) and “new money” (wealth you have earned and built yourself). While both types may have equal net worth, they have traditionally held different social standings. People of old money, firmly situated in the upper class for generations, have held high prestige. Their families have socialized them to know the customs, norms, and expectations that come with wealth. Often, the very wealthy don’t work for wages. Some study business or become lawyers in order to manage the family fortune. Others, such as Paris Hilton and Kim Kardashian, capitalize on being a rich socialite and transform that into celebrity status, flaunting a wealthy lifestyle.
However, new-money members of the upper class are not oriented to the customs and mores of the elite. They haven’t gone to the most exclusive schools. They have not established old-money social ties. People with new money might flaunt their wealth, buying sports cars and mansions, but they might still exhibit behaviors attributed to the middle and lower classes.
The Middle Class
Many people consider themselves middle class, but there are differing ideas about what that means. People with annual incomes of $150,000 call themselves middle class, as do people who annually earn $30,000. That helps explain why, in the United States, the middle class is broken into upper and lower subcategories. Upper-middle-class people tend to hold bachelor’s and postgraduate degrees. They’ve studied subjects such as business, management, law, or medicine. Lower-middle-class members hold bachelor’s degrees from four-year colleges or associate’s degrees from two-year community or technical colleges.

The upper-middle class in the United States consists of about 4.4% of all households, with incomes ranging from $150,000 to $199,000.
Alyson Hurt – Back Porch – CC BY-NC 2.0.
Comfort is a key concept to the middle class. Middle-class people work hard and live fairly comfortable lives. Upper-middle-class people tend to pursue careers that earn comfortable incomes. They provide their families with large homes and nice cars. They may go skiing or boating on vacation. Their children receive high-quality education and healthcare (Gilbert 2010).
In the lower middle class, people hold jobs supervised by members of the upper middle class. They fill technical, lower-level management or administrative support positions. Compared to lower-class work, lower-middle-class jobs carry more prestige and come with slightly higher paychecks. With these incomes, people can afford a decent, mainstream lifestyle, but they struggle to maintain it. They generally don’t have enough income to build significant savings. In addition, their grip on class status is more precarious than in the upper tiers of the class system. When budgets are tight, lower-middle-class people are often the ones to lose their jobs.
The Working Class

The working class in the United States consists of about 25% of all households, whose members work in blue-collar jobs and less skilled clerical positions.
Lisa Risager – Ebeltoft – CC BY-SA 2.0.
Working-class households generally work in blue-collar jobs such as factory work, construction, restaurant serving, and less skilled clerical positions. People in the working class typically do not have 4-year college degrees, and some do not have high school degrees. Although most are not living in official poverty, their financial situation is very uncomfortable. A single large medical bill or expensive car repair would be almost impossible to pay without going into considerable debt. Working-class families are far less likely than their wealthier counterparts to own their own homes or to send their children to college. Many of them live at risk for unemployment as their companies downsize by laying off workers even in good times, and hundreds of thousands began to be laid off when the U.S. recession began in 2008.
The Lower Class

The lower class or poor in the United States constitute about 25% of all households. Many poor individuals lack high school degrees and are unemployed or employed only part time.
Chris Hunkeler – Trailer Homes – CC BY-SA 2.0.
Although lower class is a common term, many observers prefer a less-negative sounding term like the poor, which is used here. Just like the middle and upper classes, the lower class can be divided into subsets: the working class, the working poor, and the underclass. Compared to the lower middle class, lower-class people have less of an educational background and earn smaller incomes. They work jobs that require little prior skill or experience and often do routine tasks under close supervision.
The working poor have unskilled, low-paying employment. However, their jobs rarely offer benefits such as healthcare or retirement planning, and their positions are often seasonal or temporary. They work as sharecroppers, migrant farm workers, house cleaners, and day laborers. Some are high school dropouts. Some are illiterate, unable to read job ads.
How can people work full-time and still be poor? Even working full-time, millions of the working poor earn incomes too meager to support a family. Minimum wage varies from state to state, but in many states it is approaching $8.00 per hour (Department of Labor 2014). At that rate, working 40 hours a week earns $320. That comes to $16,640 a year, before tax and deductions. Even for a single person, the pay is low. A married couple with children will have a hard time covering expenses.
The underclass is the United States’ lowest tier. Members of the underclass live mainly in inner cities. Many are unemployed or underemployed. Those who do hold jobs typically perform menial tasks for little pay. Some of the underclass are homeless. For many, welfare systems provide a much-needed support through food assistance, medical care, housing, and the like.
We will discuss the poor further when we focus later in this chapter on inequality and poverty in the United States.
Social Mobility
Social mobility refers to the ability to change positions within a social stratification system. When people improve or diminish their economic status in a way that affects social class, they experience social mobility.
Individuals can experience upward or downward social mobility for a variety of reasons. Upward mobility refers to an increase—or upward shift—in social class. In the United States, people applaud the rags-to-riches achievements of celebrities like Oprah Winfrey or LeBron James. But the truth is that relative to the overall population, the number of people who rise from poverty to wealth is very small. Still, upward mobility is not only about becoming rich and famous. In the United States, people who earn a college degree, get a job promotion, or marry someone with a good income may move up socially. In contrast, downward mobility indicates a lowering of one’s social class. Some people move downward because of business setbacks, unemployment, or illness. Dropping out of school, losing a job, or getting a divorce may result in a loss of income or status and, therefore, downward social mobility.

A college education is a key step toward achieving upward social mobility. However, the payoff of education is often higher for men than for women and for whites than for people of color.
Nazareth College – Commencement 2013 – CC BY 2.0.
A key vehicle for upward mobility is formal education. Regardless of the socioeconomic status of our parents, we are much more likely to end up in a high-paying job if we attain a college degree or, increasingly, a graduate or professional degree. Figure 8.4 “Education and Median Earnings of Year-Round, Full-Time Workers, 2007” vividly shows the difference that education makes for Americans’ median annual incomes. Notice, however, that for a given level of education, men’s incomes are greater than women’s. Figure 8.4 “Education and Median Earnings of Year-Round, Full-Time Workers, 2007” thus suggests that the payoff of education is higher for men than for women, and many studies support this conclusion (Green & Ferber, 2008). The reasons for this gender difference are complex and will be discussed further in Chapter 11 “Gender and Gender Inequality”. To the extent vertical social mobility exists in the United States, then, it is higher for men than for women and higher for whites than for people of color.
Figure 8.4 Education and Median Earnings of Year-Round, Full-Time Workers, 2007

Source: Data from U.S. Census Bureau. (2010). Statistical abstract of the United States: 2010. Washington, DC: U.S. Government Printing Office. Retrieved from http://www.census.gov/compendia/statab.
It is not uncommon for different generations of a family to belong to varying social classes. This is known as intergenerational mobility. For example, an upper-class executive may have parents who belonged to the middle class. In turn, those parents may have been raised in the lower class. Patterns of intergenerational mobility can reflect long-term societal changes.
Similarly, intragenerational mobility refers to changes in a person’s social mobility over the course of his or her lifetime. For example, the wealth and prestige experienced by one person may be quite different from that of his or her siblings.
Structural mobility happens when societal changes enable a whole group of people to move up or down the social class ladder. Structural mobility is attributable to changes in society as a whole, not individual changes. In the first half of the twentieth century, industrialization expanded the U.S. economy, raising the standard of living and leading to upward structural mobility. In today’s work economy, the recent recession and the outsourcing of jobs overseas have contributed to high unemployment rates. Many people have experienced economic setbacks, creating a wave of downward structural mobility.
When analyzing the trends and movements in social mobility, sociologists consider all modes of mobility. Scholars recognize that mobility is not as common or easy to achieve as many people think. In fact, some consider social mobility a myth. The American Dream does exist, but it is much more likely to remain only a dream unless we come from advantaged backgrounds. In fact, there is less vertical mobility in the United States than in other Western democracies. As a recent analysis summarized the evidence, “There is considerably more mobility in most of the other developed economies of Europe and Scandinavia than in the United States” (Mishel, Bernstein, & Shierholz, 2009, p. 108).
Key Takeaways
- Several ways of measuring social class exist. Functionalist and conflict sociologists disagree on which objective criteria to use in measuring social class. Subjective measures of social class, which rely on people rating their own social class, may lack some validity.
- Sociologists disagree on the number of social classes in the United States, but a common view is that the United States has four classes: upper, middle, working, and lower. Further variations exist within the upper and middle classes.
- The United States has some vertical social mobility, but not as much as several nations in Western Europe.
Self Check
about:blank
References
Beeghley, Leonard. 2008. The Structure of Social Stratification in the United States. Upper Saddle River, NJ: Prentice Hall.
Coleman, R. P., & Rainwater, L. (1978). Social standing in America. New York, NY: Basic Books.
Gilbert, D. (2011). The American class structure in an age of growing inequality (8th ed.). Thousand Oaks, CA: Pine Forge Press.
Green, C. A., & Ferber, M. A. (2008). The long-term impact of labor market interruptions: How crucial is timing? Review of Social Economy, 66, 351–379.
Hodge, R. W., Siegel, P., & Rossi, P. (1964). Occupational prestige in the United States, 1925–63. American Journal of Sociology, 70, 286–302.
Mishel, L., Bernstein, J., & Shierholz, H. (2009). The state of working America 2008/2009. Ithaca, NY: ILR Press [An imprint of Cornell University Press].
Warner, W. L., & Lunt, P. S. (1941). The social life of a modern community. New Haven, CT: Yale University Press.
Wright, E. O. (2000). Class counts: Comparative studies in class analysis. New York, NY: Cambridge University Press.
Previous: Explaining Stratification
Next: Economic Inequality and Poverty in the United States Back to top
License
Introduction to Sociology: Understanding and Changing the Social World Copyright © 2016 by University of Minnesota is licensed under a Creative Commons Attribution-NonCommercial-ShareAlike 4.0 International License, except where otherwise noted.
Share This Book
What is Empathy?
GoodTherapy® Find a Therapist Find Telehealth Find a Facility Find an Event Find a Supervisor Select a State AlabamaAlaskaArizonaArkansasCaliforniaColoradoConnecticutDelawareDistrict of ColumbiaFloridaGeorgiaHawaiiIdahoIllinoisIndianaIowaKansasKentuckyLouisianaMaineMarylandMassachusettsMichiganMinnesotaMississippiMissouriMontanaNebraskaNevadaNew HampshireNew JerseyNew MexicoNew YorkNorth CarolinaNorth DakotaOhioOklahomaOregonPennsylvaniaRhode IslandSouth CarolinaSouth DakotaTennesseeTexasUtahVermontVirginiaWashingtonWest VirginiaWisconsinWyoming
Empathy

Empathy is the ability to recognize and relate to other people’s emotions and thoughts. Empathic thinking is often characterized as the willingness and ability to place oneself in another person’s situation, to feel another person’s feelings, or to recognize that another person might experience feelings in the same way as oneself. Empathy on the part of the therapist for those in therapy is also an important characteristic of therapeutic relationships.
Understanding Empathy
Empathy is distinct from sympathy, which is the ability to care about and acknowledge another person’s feelings. It is also distinct from compassion, a trait that combines elements of both empathy and sympathy. Empathy enables compassion as well as acts of charity but is not a necessary prerequisite for either; people may behave kindly for a number of reasons, many of which are not related to empathy.
Altruism, or unselfish behavior that benefits others, is closely related to empathy. Altruistic acts generally indicate that a person experiences a high level of compassion for others. Studies show that many animals other than humans, such as primates and bears, are capable of altruistic behavior.
Empathy and Psychology
People who score high on measures of empathy generally report larger social circles and more satisfying relationships, as empathy plays a pivotal role in personal relationships: Couples in counseling are frequently advised to work on developing empathy for one another. Empathy is not only essential in relating to loved ones but also in anticipating motives, persuading others, and working successfully with colleagues and employers.
Lack of empathy plays an important role in several mental health conditions, particularly antisocial personality, which causes a long-term pattern of exploitation, sociopathic behavior, and violation of the rights of others. A diagnosis of certain mental health conditions, such as narcissistic personality, may also indicate a lack of empathy or difficulty feeling or expressing it.
Role of Empathy in Therapy
Empathy is considered essential to therapy because for any therapeutic tactic to work, the therapist has to make the person in treatment feel understood. To do this, the therapist must not only understand what a person says in a therapy session but also understand what the person is not saying and communicate this understanding. Therapists who are highly empathic can help people in treatment face past experiences and obtain a greater understanding of both the experience and feelings surrounding it.
Empathy is different from sympathy, which can imply pity, and conveying empathy is also not a passive process. A good therapist will generally be able to sense another person’s emotion through concentration and active listening, but the process requires continued engagement. Because empathy can be expressed in many ways, especially in therapy, there is no “right” way for a therapist to demonstrate understanding and acceptance to those in treatment.
Five-Point Scale to Measure Empathy
Several scales have been developed to measure empathy. The Empathy Quotient test, for example, can measure how easily one picks up on the feelings of others and how much one is affected by those feelings. This test shows that women typically have greater empathy than men, and that those with Asperger’s or high-functioning autism typically demonstrate a lower capacity for empathy.
Another test, Carkhuff’s five-point scale, can be applied to all human relations, but it is effective at measuring the use of empathy by therapists in session. It is based on observable behavior and attempts to eliminate the ambiguity of previous scales.
- Level 1 (nonempathic behavior): The therapist responds in a way that ignores the message of the person in treatment.
- Level 2 (nonempathic behavior): The therapist attempts to understand and respond to the message but does so in a way that lessens the impact.
- Level 3: The therapist responds to a stated message and surface expressions but ignores or is unable to hear the implicit message and feelings of the person in treatment. This may be an appropriate response at times, but if a therapist always responds at this level, he or she is generally not expressing deep empathy.
- Level 4: The therapist’s response adds to what the person has said, demonstrating that the therapist has understood both what was said and what may have been only implied.
- Level 5: The therapist understands what the person in treatment meant, and the therapist’s response adds to what the person has said in such a way that he or she is able to accurately expand upon the person’s thoughts without beginning to interpret or suggest new explanations.
Origins of Empathy
Empathy is probably, to some extent, an evolved trait. It allows humans to be able to be able to reach out to others emotionally from a young age but also to understand the situations of others. Empathy likely evolved, according to researchers, out of the necessity to be aware of the needs of the young, but also out of the knowledge that when the group does well, the individual does well.
Researchers believe that empathy develops early in childhood, as even young infants react to the distress of others. Studies show that when parents discipline children by pointing out how their behavior has affected another, the children may then become more empathic. Empathy can also be affected by being around strangers, studies have found. Being around strangers leads to increased levels of stress, which appears to affect a person’s ability to feel the pain of another. However, doing an activity with strangers, such as playing a game, can lead to a reduction in stress and an increase in empathy.
Empathy in Animals
Several studies have indicated that animals are capable of empathetic reactions. The ability to feel empathy can be a survival strategy, as it enables an animal to anticipate reactions and to form social bonds, which may have a protective effect in an unstable environment.
Many kinds of apes show empathy. Chimpanzees are very attuned to the emotions of others, so much that humans studying them can use displays of emotion, such as feigned sadness, to cause a disobedient chimp to behave. Orangutans and gorillas care for each other, especially for family members, and react to the emotions of others. Some apes will avoid taking a treat if doing so causes another ape to receive a painful shock. This altruistic behavior demonstrates the empathy primates have for other members of their species.
Other animals that show empathy include rodents: Rats refused to pull a lever to shock littermates, even if they were only fed after doing so, and mice grimace when mice they have shared a cage with are in pain. Elephants and some birds, such as crows, ravens, and jays, have all been known to show empathy to other members of their species, as well. Dogs and cats also demonstrate empathy, both toward humans and other animals.
The “Cost of Caring”
Recent research shows that some people may be affected more than others by negative life events experienced by other people. This “cost of caring” suggests that too much empathy can occasionally lead to emotional distress. According to a 2013 study, highly empathetic women who saw on social media that a close friend or family member was injured, hospitalized, demoted, or mourning a loss experienced a stress level that was 5-14% higher than that of other women. Men with high levels of empathy who saw that a friend or family member was demoted or accused of a crime experienced a stress level 9-15% higher than that of other men.
Because highly empathetic people may be more affected by the distress of family, friends, and others in their care and become overwhelmed as a result, maintaining a self-care routine and establishing emotional boundaries can be helpful in preventing any negative effects that taking on the stress of others may have on mental health.
References:
- Baron-Cohen, S., & Wheelwright, S. (2004, April 1). The empathy quotient: An investigation of adults with Asperger syndrome or high functioning autism, and normal sex differences. Retrieved from http://www.ncbi.nlm.nih.gov/pubmed/15162935.
- Dallas, K. (2015, February 21). ‘Too much of a good thing’: When empathy is overwhelming. Retrieved from http://national.deseretnews.com/article/3609/too-much-of-a-good-thing-when-empathy-is-overwhelming.html.
- Ghose, T. (2015, January 15). ‘Stranger Danger’ Makes People Less Empathetic. Retrieved from http://news.discovery.com/human/psychology/stranger-danger-makes-people-less-empathetic-150115.htm.
- Goleman, D. (1989, March 27). Researchers Trace Empathy’s Roots to Infancy. Retrieved from http://www.nytimes.com/1989/03/28/science/researchers-trace-empathy-s-roots-to-infancy.html.
- Martin, D. (2010). Counseling & Therapy Skills (3rd ed., p. 4, 8, 12-13, 127). Long Grove, Illinois: Manitoba Press.
- Prinz, J. J. (2007). The emotional construction of morals. Oxford: Oxford University Press.
- The Empathy Quotient. (n.d.). Retrieved from http://www.theguardian.com/life/table/0,,937442,00.html.
- Viegas, J. (2014, February 18). Elephants Added to List of Animals that Show Empathy. Retrieved from http://news.discovery.com/animals/elephants-added-to-list-of-animals-that-show-empathy-140218.htm.
Last Updated: 08-6-2015


Read More
- Empathy Improves Relationships
- Being Mindful of ‘Kindfull’ Play: Empathy-Building Play Therapy
- How to Teach Children Emotional Intelligence
- 11 comments
- Leave a Comment
- anthonySeptember 28th, 2016 at 2:40 AMhi i would just like to know the author of the blog “Empathy” for my reference list. thank youReply
- The GoodTherapy.org TeamSeptember 28th, 2016 at 8:13 AMHi Anthony,
This article does not have a single author, but you can attribute it to GoodTherapy.org staff members.Kind regards,
The GoodTherapy.org TeamReply - PaulOctober 17th, 2016 at 12:10 AMThats what I wanted to learn. Thanks alot.Reply
Leave a Comment
By commenting you acknowledge acceptance of GoodTherapy.org’s Terms and Conditions of Use.Name:*Email address:*Comment:*
https://www.google.com/recaptcha/api2/anchor?ar=1&k=6LepntASAAAAAD716pIdog11FZF3_1hus4CixtrC&co=aHR0cHM6Ly93d3cuZ29vZHRoZXJhcHkub3JnOjQ0Mw..&hl=en&v=GUGrl5YkSwqiWrzO3ShIKDlu&size=normal&cb=3l3fb0xjabgv Notify me when new comments are added. Subscribe me to the GoodTherapy.org public newsletter.
* Indicates required field.
null
See Also
Notice to users
GoodTherapy.org is not intended to be a substitute for professional advice, diagnosis, medical treatment, or therapy. Always seek the advice of your physician or qualified mental health provider with any questions you may have regarding any mental health symptom or medical condition. Never disregard professional psychological or medical advice nor delay in seeking professional advice or treatment because of something you have read on GoodTherapy.org.
About GoodTherapy
Resources
SUBSCRIBE TO NEWSLETTER
* indicates requiredEmail Address *
Follow GoodTherapy
Copyright © 2007 – 2025 GoodTherapy, LLC. All rights reserved.
Home Terms of Service Privacy Policy Sitemap Subscribe to our Newsletter
null


